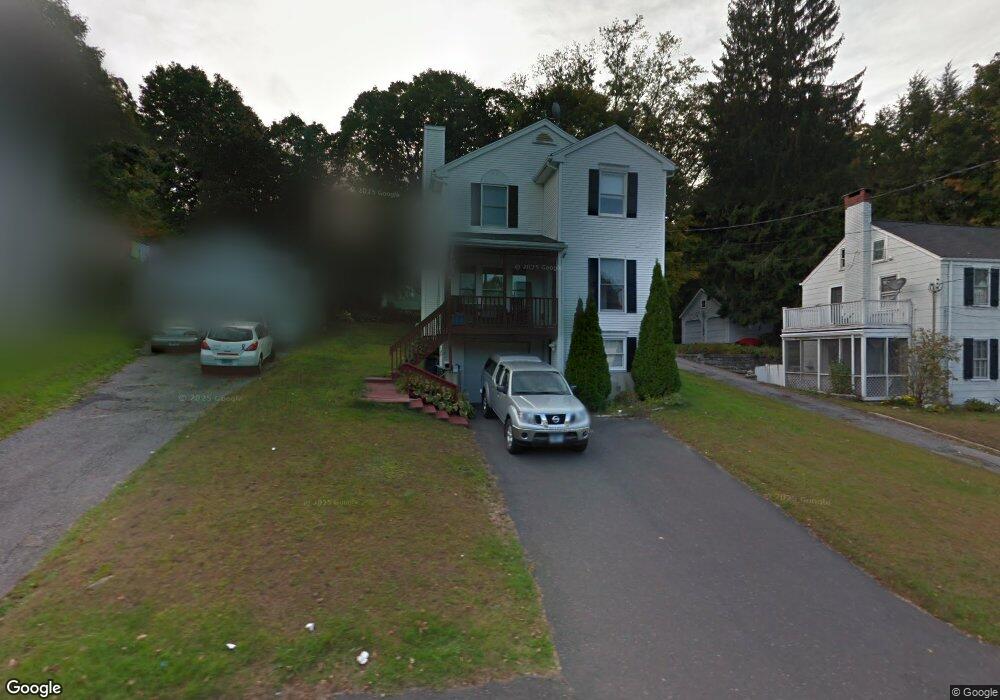
31 Smith St Torrington, CT 06790
Estimated Value: $291,000 - $318,189
3
Beds
2
Baths
1,368
Sq Ft
$223/Sq Ft
Est. Value
About This Home
This home is located at 31 Smith St, Torrington, CT 06790 and is currently estimated at $304,797, approximately $222 per square foot. 31 Smith St is a home located in Litchfield County with nearby schools including Torrington Middle School, Torrington High School, and St. John Paul the Great Academy.
Ownership History
Date
Name
Owned For
Owner Type
Purchase Details
Closed on
Dec 26, 1995
Sold by
Citicorp Mtg Corp
Bought by
Formaggioni R Ronald L
Current Estimated Value
Home Financials for this Owner
Home Financials are based on the most recent Mortgage that was taken out on this home.
Original Mortgage
$73,600
Interest Rate
7.33%
Mortgage Type
Unknown
Purchase Details
Closed on
May 8, 1991
Sold by
Eucalitto Gary W
Bought by
Mayerjak Glenn Y and Mayerjak Cindy L
Create a Home Valuation Report for This Property
The Home Valuation Report is an in-depth analysis detailing your home's value as well as a comparison with similar homes in the area
Home Values in the Area
Average Home Value in this Area
Purchase History
| Date | Buyer | Sale Price | Title Company |
|---|---|---|---|
| Formaggioni R Ronald L | $92,000 | -- | |
| Mayerjak Glenn Y | $133,000 | -- |
Source: Public Records
Mortgage History
| Date | Status | Borrower | Loan Amount |
|---|---|---|---|
| Open | Mayerjak Glenn Y | $66,000 | |
| Closed | Mayerjak Glenn Y | $86,000 | |
| Closed | Mayerjak Glenn Y | $8,000 | |
| Closed | Mayerjak Glenn Y | $73,600 |
Source: Public Records
Tax History
| Year | Tax Paid | Tax Assessment Tax Assessment Total Assessment is a certain percentage of the fair market value that is determined by local assessors to be the total taxable value of land and additions on the property. | Land | Improvement |
|---|---|---|---|---|
| 2025 | $6,941 | $180,530 | $23,800 | $156,730 |
| 2024 | $4,307 | $89,790 | $23,760 | $66,030 |
| 2023 | $4,306 | $89,790 | $23,760 | $66,030 |
| 2022 | $4,233 | $89,790 | $23,760 | $66,030 |
| 2021 | $4,146 | $89,790 | $23,760 | $66,030 |
| 2020 | $4,146 | $89,790 | $23,760 | $66,030 |
| 2019 | $4,716 | $102,140 | $29,200 | $72,940 |
| 2018 | $4,716 | $102,140 | $29,200 | $72,940 |
| 2017 | $4,673 | $102,140 | $29,200 | $72,940 |
| 2016 | $4,673 | $102,140 | $29,200 | $72,940 |
| 2015 | $4,673 | $102,140 | $29,200 | $72,940 |
| 2014 | $4,575 | $125,970 | $40,260 | $85,710 |
Source: Public Records
Map
Nearby Homes
- 0 Highland Ave Unit 24088105
- 95 Colorado Ave N
- 115 Beechwood Ave
- 80 Washington Ave
- 146 Beechwood Ave
- 58 Eggleston St
- 163 Beechwood Ave
- 329 Church St
- 108 Culvert St
- 116 High St
- 231 Beechwood Ave
- 30 Culvert St
- 42 Pulver St
- 398 Funston Ave
- 155 Allen Rd
- 00 Church St
- 7 Ford Ln
- 85 Ford Ln
- 118 Pearl St
- 72 French St
Your Personal Tour Guide
Ask me questions while you tour the home.