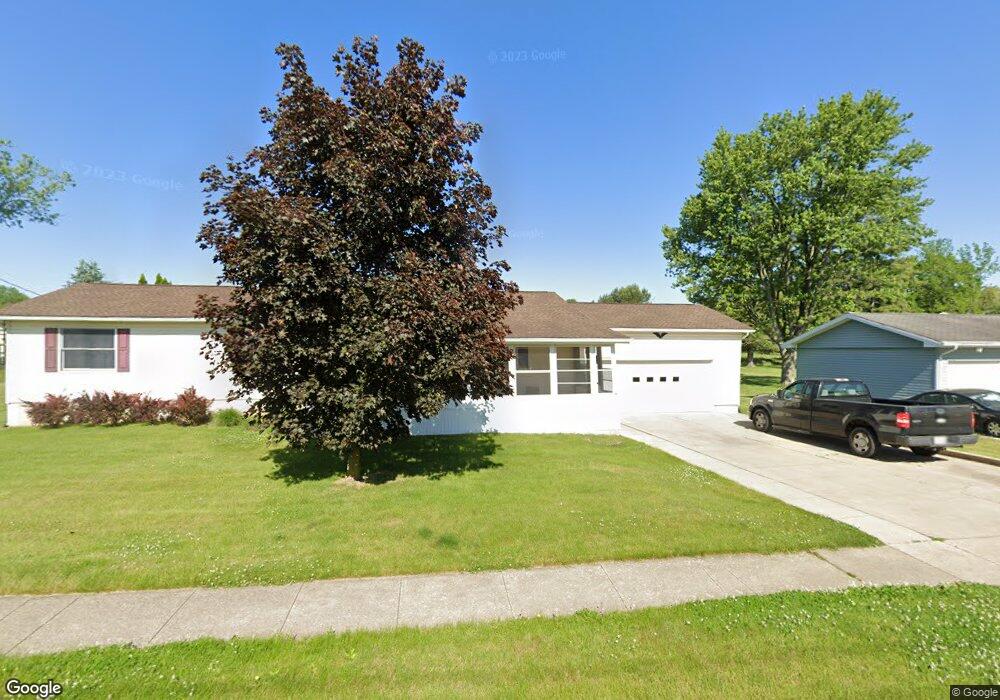
31 Sychar Rd Mount Vernon, OH 43050
Estimated Value: $257,000 - $314,000
3
Beds
3
Baths
1,680
Sq Ft
$171/Sq Ft
Est. Value
About This Home
This home is located at 31 Sychar Rd, Mount Vernon, OH 43050 and is currently estimated at $287,245, approximately $170 per square foot. 31 Sychar Rd is a home located in Knox County with nearby schools including Mount Vernon High School, St. Vincent de Paul School, and Mount Vernon Sda Elementary School.
Ownership History
Date
Name
Owned For
Owner Type
Purchase Details
Closed on
Dec 9, 2016
Sold by
Williams Hoyt S and Williams Peggy L
Bought by
Williams Todd A and Williams Katherine Ann
Current Estimated Value
Home Financials for this Owner
Home Financials are based on the most recent Mortgage that was taken out on this home.
Original Mortgage
$102,000
Outstanding Balance
$82,236
Interest Rate
3.47%
Mortgage Type
New Conventional
Estimated Equity
$205,009
Purchase Details
Closed on
Nov 17, 1995
Sold by
Zenil Craig and Zenil Laila
Bought by
Williams Hoyt S and Williams Peggy L
Create a Home Valuation Report for This Property
The Home Valuation Report is an in-depth analysis detailing your home's value as well as a comparison with similar homes in the area
Home Values in the Area
Average Home Value in this Area
Purchase History
| Date | Buyer | Sale Price | Title Company |
|---|---|---|---|
| Williams Todd A | $130,000 | None Available | |
| Williams Hoyt S | $8,000 | -- |
Source: Public Records
Mortgage History
| Date | Status | Borrower | Loan Amount |
|---|---|---|---|
| Open | Williams Todd A | $102,000 |
Source: Public Records
Tax History
| Year | Tax Paid | Tax Assessment Tax Assessment Total Assessment is a certain percentage of the fair market value that is determined by local assessors to be the total taxable value of land and additions on the property. | Land | Improvement |
|---|---|---|---|---|
| 2024 | $3,325 | $88,140 | $11,960 | $76,180 |
| 2023 | $3,399 | $88,140 | $11,960 | $76,180 |
| 2022 | $2,576 | $60,790 | $8,250 | $52,540 |
| 2021 | $2,576 | $60,790 | $8,250 | $52,540 |
| 2020 | $2,509 | $60,790 | $8,250 | $52,540 |
| 2019 | $2,201 | $49,690 | $8,900 | $40,790 |
| 2018 | $2,201 | $49,690 | $8,900 | $40,790 |
| 2017 | $2,161 | $49,690 | $8,900 | $40,790 |
| 2016 | $2,062 | $46,020 | $8,250 | $37,770 |
| 2015 | $2,071 | $46,020 | $8,250 | $37,770 |
| 2014 | $2,082 | $46,020 | $8,250 | $37,770 |
| 2013 | $2,206 | $46,470 | $6,700 | $39,770 |
Source: Public Records
Map
Nearby Homes
- 0 Miami St
- 418 E Pleasant St
- 14 Hilltop Dr
- 108 Ringold St
- 220 Coshocton Ave
- 600 1/2 E Chestnut St
- 600 E Chestnut St Unit 1/2
- 332 Wooster Rd
- 208 E Burgess St
- 104 N Park St
- 608 N Gay St
- 12 3rd Ave
- 12 Third Ave
- 501 Oak St
- 304 N Gay St
- 111 Potwin St
- 203 S Center St
- 200 Eastwood Dr
- 6 Edgewood Blvd
- 655 Howard St
Your Personal Tour Guide
Ask me questions while you tour the home.