31 Sychar Rd Mount Vernon, OH 43050
Mount Vernon AreaEstimated Value: $279,637
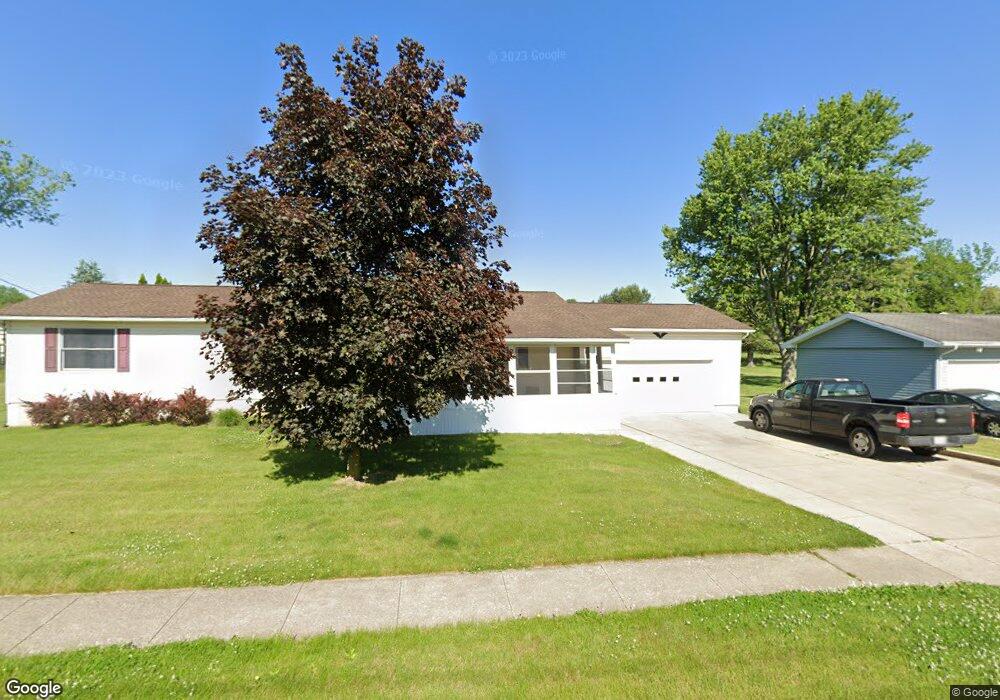
About This Home
This home is located at 31 Sychar Rd, Mount Vernon, OH 43050 and is currently priced at $279,637, approximately $166 per square foot. 31 Sychar Rd is a home located in Knox County.
Ownership History
We collect this data history from publicly available records. To have your information removed, we recommend requesting removal directly through your county’s website.
Purchase Details
Home Financials for this Owner
Home Financials are based on the most recent Mortgage that was taken out on this home.Purchase Details
Home Values in the Area
Average Home Value in this Area
Purchase History
We collect this data history from publicly available records. To have your information removed, we recommend requesting removal directly through your county’s website.
| Date | Buyer | Sale Price | Title Company |
|---|---|---|---|
| $130,000 | None Available | ||
| $8,000 | -- |
Mortgage History
We collect this data history from publicly available records. To have your information removed, we recommend requesting removal directly through your county’s website.
| Date | Status | Borrower | Loan Amount |
|---|---|---|---|
| Open | $176,250 | ||
| Closed | $25,000 | ||
| Closed | $102,000 |
Tax History
We collect this data history from publicly available records. To have your information removed, we recommend requesting removal directly through your county’s website.
| Year | Tax Paid | Tax Assessment Tax Assessment Total Assessment is a certain percentage of the fair market value that is determined by local assessors to be the total taxable value of land and additions on the property. | Land | Improvement |
|---|---|---|---|---|
| 2025 | $3,055 | $88,140 | $11,960 | $76,180 |
| 2024 | $3,325 | $88,140 | $11,960 | $76,180 |
| 2023 | $3,399 | $88,140 | $11,960 | $76,180 |
| 2022 | $2,576 | $60,790 | $8,250 | $52,540 |
| 2021 | $2,576 | $60,790 | $8,250 | $52,540 |
| 2020 | $2,509 | $60,790 | $8,250 | $52,540 |
| 2019 | $2,201 | $49,690 | $8,900 | $40,790 |
| 2018 | $2,201 | $49,690 | $8,900 | $40,790 |
| 2017 | $2,161 | $49,690 | $8,900 | $40,790 |
| 2016 | $2,062 | $46,020 | $8,250 | $37,770 |
| 2015 | $2,071 | $46,020 | $8,250 | $37,770 |
| 2014 | $2,082 | $46,020 | $8,250 | $37,770 |
| 2013 | $2,206 | $46,470 | $6,700 | $39,770 |
Map
- 12 Kenyon St
- 11 Oberlin St
- 521 E Burgess St
- 706 E Burgess St
- 505 E Burgess St
- 518 E HamtraMcK St
- 7 Eastgate Dr
- 56 Highmeadow Dr
- 219 Coshocton Ave
- 117 N Center St
- 14 Highland Dr
- 206 N Division St
- 205 N Division St
- 612 E High St
- 4 N Division St
- 118 E Burgess St
- 204 E Sugar St
- 113 E HamtraMcK St Unit 1/2
- 933 E High St
- 11 Old Orchard Dr
Ask me questions while you tour the home.