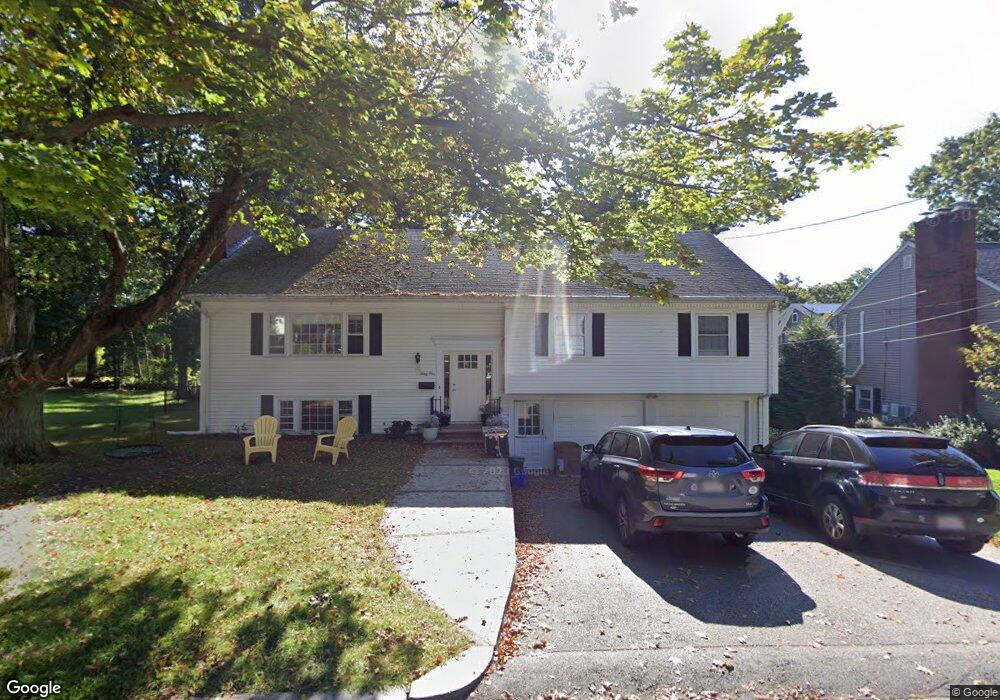
31 Tomahawk Rd Arlington, MA 02474
Arlington Heights NeighborhoodEstimated Value: $1,084,000 - $1,336,000
3
Beds
3
Baths
2,156
Sq Ft
$585/Sq Ft
Est. Value
About This Home
This home is located at 31 Tomahawk Rd, Arlington, MA 02474 and is currently estimated at $1,260,403, approximately $584 per square foot. 31 Tomahawk Rd is a home located in Middlesex County with nearby schools including M. Norcross Stratton Elementary School, Peirce Elementary School, and Ottoson Middle School.
Ownership History
Date
Name
Owned For
Owner Type
Purchase Details
Closed on
Jan 12, 2015
Sold by
Campbell Paul R and Campbell Bonnie C
Bought by
Campbell Patricia M
Current Estimated Value
Home Financials for this Owner
Home Financials are based on the most recent Mortgage that was taken out on this home.
Original Mortgage
$350,000
Outstanding Balance
$265,672
Interest Rate
3.99%
Mortgage Type
New Conventional
Estimated Equity
$994,731
Create a Home Valuation Report for This Property
The Home Valuation Report is an in-depth analysis detailing your home's value as well as a comparison with similar homes in the area
Home Values in the Area
Average Home Value in this Area
Purchase History
| Date | Buyer | Sale Price | Title Company |
|---|---|---|---|
| Campbell Patricia M | $350,000 | -- |
Source: Public Records
Mortgage History
| Date | Status | Borrower | Loan Amount |
|---|---|---|---|
| Open | Campbell Patricia M | $350,000 |
Source: Public Records
Tax History
| Year | Tax Paid | Tax Assessment Tax Assessment Total Assessment is a certain percentage of the fair market value that is determined by local assessors to be the total taxable value of land and additions on the property. | Land | Improvement |
|---|---|---|---|---|
| 2025 | $11,243 | $1,043,900 | $572,100 | $471,800 |
| 2024 | $10,798 | $1,019,600 | $572,100 | $447,500 |
| 2023 | $9,662 | $861,900 | $492,300 | $369,600 |
| 2022 | $9,157 | $801,800 | $465,700 | $336,100 |
| 2021 | $9,092 | $801,800 | $465,700 | $336,100 |
| 2020 | $8,868 | $801,800 | $465,700 | $336,100 |
| 2019 | $8,398 | $745,800 | $465,700 | $280,100 |
| 2018 | $8,231 | $678,600 | $399,100 | $279,500 |
| 2017 | $8,189 | $652,000 | $372,500 | $279,500 |
| 2016 | $7,665 | $598,800 | $319,300 | $279,500 |
| 2015 | $7,294 | $538,300 | $286,000 | $252,300 |
Source: Public Records
Map
Nearby Homes
- 337 Washington St
- 11 Lorraine Terrace
- 69 Edmund Rd
- 281 Forest St
- 143 Wright St
- 12 Elwern Rd
- 10 Viking Rd
- 455-457 Summer St
- 455 Summer St Unit 455
- 66 Hutchinson Rd
- 37 Mayflower Rd
- 7 Bow St
- 72 Thesda St
- 4 Beck Rd
- 39 Forest St Unit 39A
- 15 Edward Dr Unit 15
- 15 Mayflower Rd
- 8 Old Colony Ln Unit 2
- 1 Watermill Place Unit 312
- 11 Lowell St Unit B
Your Personal Tour Guide
Ask me questions while you tour the home.