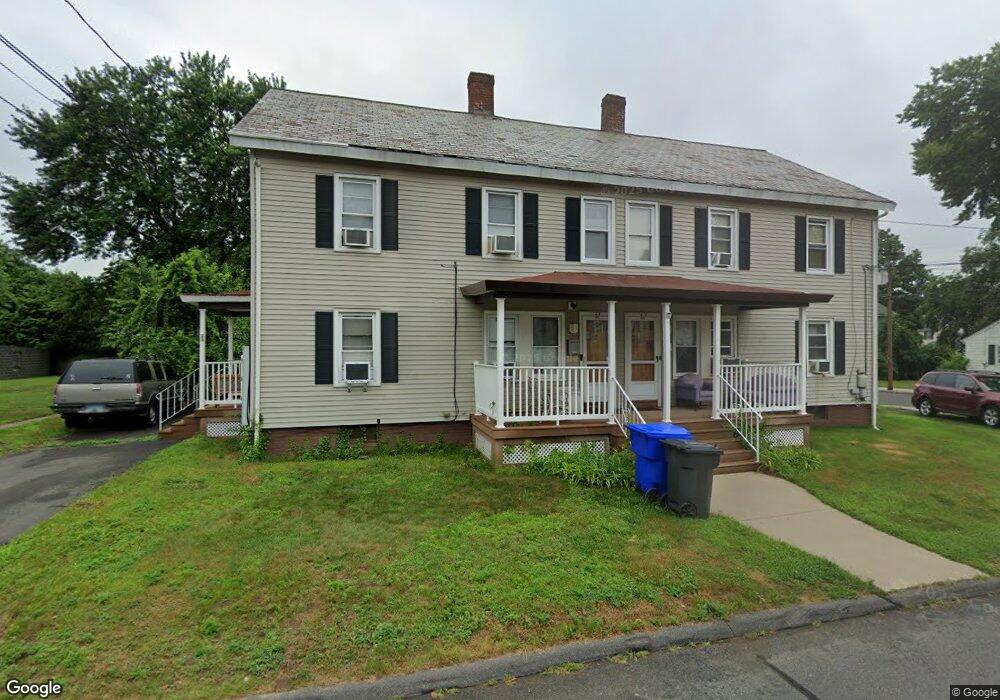
31 Union St Enfield, CT 06082
Estimated Value: $269,000 - $323,000
3
Beds
1
Bath
1,288
Sq Ft
$227/Sq Ft
Est. Value
About This Home
This home is located at 31 Union St, Enfield, CT 06082 and is currently estimated at $291,772, approximately $226 per square foot. 31 Union St is a home located in Hartford County with nearby schools including Henry Barnard Elementary School, Prudence Crandall Elementary School, and Enfield High School.
Ownership History
Date
Name
Owned For
Owner Type
Purchase Details
Closed on
Nov 16, 2020
Sold by
Collectible Commodity Llc
Bought by
Clark Alvin D
Current Estimated Value
Home Financials for this Owner
Home Financials are based on the most recent Mortgage that was taken out on this home.
Original Mortgage
$199,500
Outstanding Balance
$177,527
Interest Rate
2.8%
Mortgage Type
New Conventional
Estimated Equity
$114,245
Purchase Details
Closed on
Jul 9, 2020
Sold by
Heroux Russell
Bought by
Collectible Commodity Llc
Home Financials for this Owner
Home Financials are based on the most recent Mortgage that was taken out on this home.
Original Mortgage
$95,000
Interest Rate
3.1%
Mortgage Type
Future Advance Clause Open End Mortgage
Purchase Details
Closed on
Oct 4, 2002
Sold by
Stonge Kevin
Bought by
Heroux Russell
Purchase Details
Closed on
Oct 18, 1999
Sold by
Alaimo Joan
Bought by
Stonge Kevin
Create a Home Valuation Report for This Property
The Home Valuation Report is an in-depth analysis detailing your home's value as well as a comparison with similar homes in the area
Home Values in the Area
Average Home Value in this Area
Purchase History
| Date | Buyer | Sale Price | Title Company |
|---|---|---|---|
| Clark Alvin D | $210,000 | None Available | |
| Collectible Commodity Llc | $60,000 | None Available | |
| Heroux Russell | $121,500 | -- | |
| Stonge Kevin | $95,000 | -- |
Source: Public Records
Mortgage History
| Date | Status | Borrower | Loan Amount |
|---|---|---|---|
| Open | Clark Alvin D | $199,500 | |
| Previous Owner | Collectible Commodity Llc | $95,000 | |
| Previous Owner | Stonge Kevin | $169,000 | |
| Previous Owner | Stonge Kevin | $153,000 | |
| Previous Owner | Stonge Kevin | $128,000 |
Source: Public Records
Tax History
| Year | Tax Paid | Tax Assessment Tax Assessment Total Assessment is a certain percentage of the fair market value that is determined by local assessors to be the total taxable value of land and additions on the property. | Land | Improvement |
|---|---|---|---|---|
| 2025 | $5,878 | $157,600 | $37,500 | $120,100 |
| 2024 | $5,721 | $157,600 | $37,500 | $120,100 |
| 2023 | $5,721 | $157,600 | $37,500 | $120,100 |
| 2022 | $5,300 | $157,600 | $37,500 | $120,100 |
| 2021 | $5,167 | $125,750 | $31,090 | $94,660 |
| 2020 | $4,142 | $101,800 | $31,090 | $70,710 |
| 2019 | $4,176 | $101,800 | $31,090 | $70,710 |
| 2018 | $4,085 | $101,800 | $31,090 | $70,710 |
| 2017 | $4,049 | $101,800 | $31,090 | $70,710 |
| 2016 | $3,924 | $100,100 | $31,090 | $69,010 |
| 2015 | $2,379 | $100,100 | $31,090 | $69,010 |
| 2014 | $3,642 | $100,100 | $31,090 | $69,010 |
Source: Public Records
Map
Nearby Homes
- 39 Union Street Extension
- 54 Hartford Ave
- 42 Hartford Ave
- 64 Hartford Ave
- 148 Pleasant St
- 97 Pleasant St
- 60 Lincoln St
- 30-32 Church St
- 26-28 Church St
- 127 Windsor St
- 40 Church St
- 9 Virginia Ave
- 57 Asnuntuck St
- 23 Woodlawn Ave
- 32 Parker St
- 73 Laurel St
- 9 Eleanor Rd
- 15 Summer St
- 41 Walnut St
- 69 Prospect St
- 31 Union Street Extension
- 31 Lafayette St
- 28 Union St
- 39 Union St
- 27 Union St
- 27 Lafayette St
- 33 Union St
- 24 Union St
- 24 Union St Unit 24 Union St
- 30 Union St
- 22 Lafayette St
- 62 Windsor St
- 72 Windsor St
- 37 Union Street Extension
- 37 Union Street Extension
- 20 Union St
- 82 Windsor St Unit 1
- 56 Windsor St
- 18 Lafayette St
- 32 Union St
Your Personal Tour Guide
Ask me questions while you tour the home.