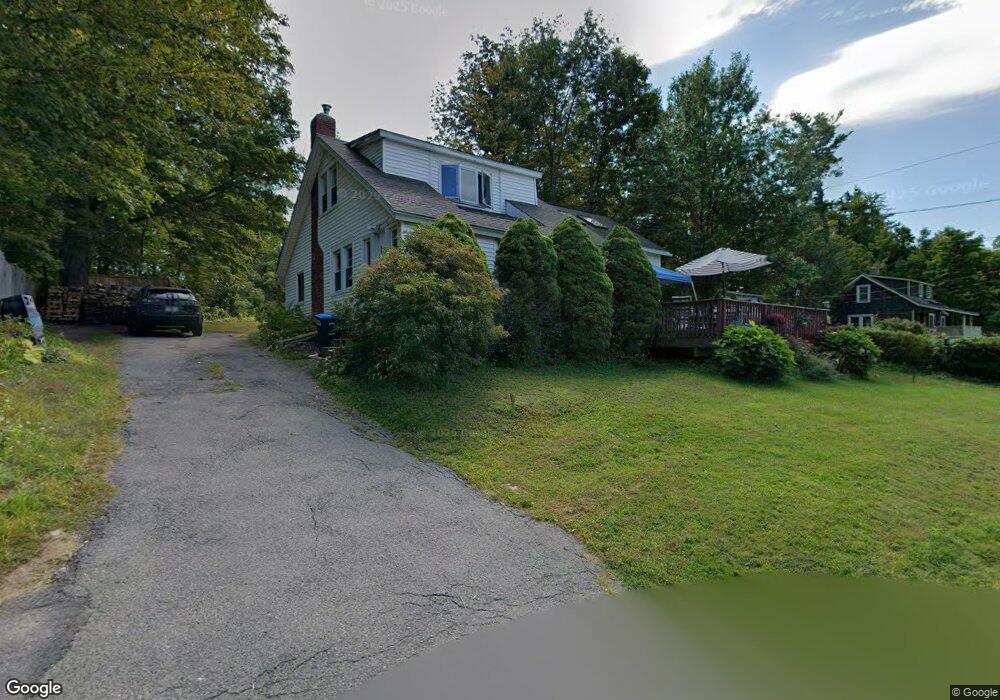
31 Upland Rd Pittsfield, MA 01201
Estimated Value: $251,000 - $296,000
3
Beds
2
Baths
1,464
Sq Ft
$187/Sq Ft
Est. Value
About This Home
This home is located at 31 Upland Rd, Pittsfield, MA 01201 and is currently estimated at $273,534, approximately $186 per square foot. 31 Upland Rd is a home located in Berkshire County with nearby schools including Robert T. Capeless Elementary School, John T. Reid Middle School, and Taconic High School.
Ownership History
Date
Name
Owned For
Owner Type
Purchase Details
Closed on
Mar 19, 1998
Sold by
Hansen David O and Hansen Sandra M
Bought by
Porter Robert E
Current Estimated Value
Home Financials for this Owner
Home Financials are based on the most recent Mortgage that was taken out on this home.
Original Mortgage
$64,000
Outstanding Balance
$11,605
Interest Rate
6.92%
Mortgage Type
Purchase Money Mortgage
Estimated Equity
$261,929
Purchase Details
Closed on
Dec 26, 1997
Sold by
Jones Wiulliam
Bought by
Hansen David O and Mansen Sandra M
Create a Home Valuation Report for This Property
The Home Valuation Report is an in-depth analysis detailing your home's value as well as a comparison with similar homes in the area
Home Values in the Area
Average Home Value in this Area
Purchase History
| Date | Buyer | Sale Price | Title Company |
|---|---|---|---|
| Porter Robert E | $68,000 | -- | |
| Porter Robert E | $68,000 | -- | |
| Hansen David O | $50,000 | -- | |
| Hansen David O | $50,000 | -- |
Source: Public Records
Mortgage History
| Date | Status | Borrower | Loan Amount |
|---|---|---|---|
| Open | Hansen David O | $64,000 | |
| Closed | Hansen David O | $64,000 |
Source: Public Records
Tax History
| Year | Tax Paid | Tax Assessment Tax Assessment Total Assessment is a certain percentage of the fair market value that is determined by local assessors to be the total taxable value of land and additions on the property. | Land | Improvement |
|---|---|---|---|---|
| 2025 | $4,490 | $250,300 | $85,100 | $165,200 |
| 2024 | $4,452 | $241,300 | $85,100 | $156,200 |
| 2023 | $3,996 | $218,100 | $75,600 | $142,500 |
| 2022 | $3,525 | $189,900 | $66,200 | $123,700 |
| 2021 | $3,163 | $164,300 | $66,200 | $98,100 |
| 2020 | $2,988 | $151,600 | $56,700 | $94,900 |
| 2019 | $2,732 | $140,700 | $49,100 | $91,600 |
| 2018 | $2,747 | $137,300 | $49,100 | $88,200 |
| 2017 | $2,599 | $132,400 | $47,300 | $85,100 |
| 2016 | $2,426 | $129,300 | $47,300 | $82,000 |
| 2015 | $2,335 | $129,300 | $47,300 | $82,000 |
Source: Public Records
Map
Nearby Homes
- 14 Sunrise Cir
- 140 Hancock Rd
- 30 Pinehurst Ave
- 0 Beacon Ave
- 36 Beacon Ave
- 55 Newton Ave
- 0 Oakhurst Ave
- 1223 North St
- 15 Orlando Ave
- 29 Murphy Place
- 119 Orlando Ave
- 11 Crane Ave
- 5 Marco Dr
- 26 Davis St
- 11 Mcallister St
- 580 S Main St Unit Building 1, Unit 6
- 580 S Main St Unit Building 4 unit 2
- 0 Faucett Ln
- 25 Calumet St
- 144 Brombach St
Your Personal Tour Guide
Ask me questions while you tour the home.