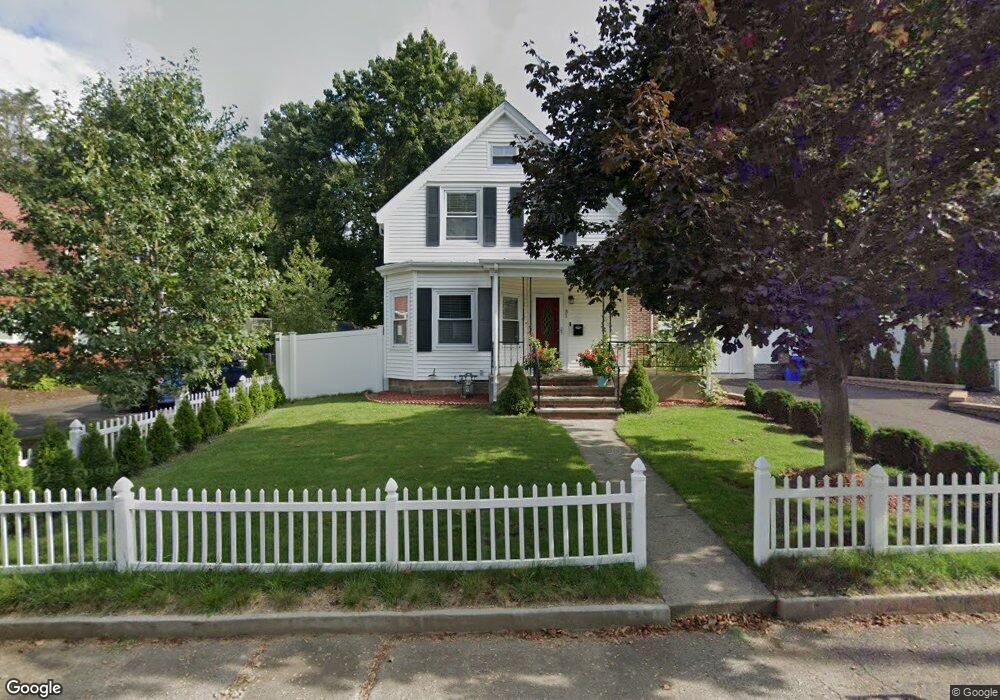
31 Upland St Holbrook, MA 02343
Estimated Value: $540,000 - $607,000
3
Beds
3
Baths
1,634
Sq Ft
$352/Sq Ft
Est. Value
About This Home
This home is located at 31 Upland St, Holbrook, MA 02343 and is currently estimated at $575,481, approximately $352 per square foot. 31 Upland St is a home located in Norfolk County with nearby schools including John F. Kennedy Elementary School, Holbrook Middle High School, and Boston Higashi School.
Ownership History
Date
Name
Owned For
Owner Type
Purchase Details
Closed on
Feb 6, 2017
Sold by
Mohan Helen A
Bought by
Bonnefoi Alexandre and Mohan Taryn
Current Estimated Value
Home Financials for this Owner
Home Financials are based on the most recent Mortgage that was taken out on this home.
Original Mortgage
$271,000
Outstanding Balance
$225,002
Interest Rate
4.3%
Mortgage Type
New Conventional
Estimated Equity
$350,479
Purchase Details
Closed on
Jun 19, 1992
Sold by
Kelcourse Richard L
Bought by
Mohan Helen A
Home Financials for this Owner
Home Financials are based on the most recent Mortgage that was taken out on this home.
Original Mortgage
$70,000
Interest Rate
8.67%
Create a Home Valuation Report for This Property
The Home Valuation Report is an in-depth analysis detailing your home's value as well as a comparison with similar homes in the area
Home Values in the Area
Average Home Value in this Area
Purchase History
| Date | Buyer | Sale Price | Title Company |
|---|---|---|---|
| Bonnefoi Alexandre | $310,000 | -- | |
| Mohan Helen A | $97,000 | -- | |
| Mohan Helen A | $97,000 | -- |
Source: Public Records
Mortgage History
| Date | Status | Borrower | Loan Amount |
|---|---|---|---|
| Open | Bonnefoi Alexandre | $271,000 | |
| Previous Owner | Mohan Helen A | $70,000 | |
| Previous Owner | Mohan Helen A | $54,000 |
Source: Public Records
Tax History Compared to Growth
Tax History
| Year | Tax Paid | Tax Assessment Tax Assessment Total Assessment is a certain percentage of the fair market value that is determined by local assessors to be the total taxable value of land and additions on the property. | Land | Improvement |
|---|---|---|---|---|
| 2025 | $63 | $475,300 | $216,500 | $258,800 |
| 2024 | $5,865 | $436,400 | $196,800 | $239,600 |
| 2023 | $6,235 | $405,400 | $179,000 | $226,400 |
| 2022 | $5,864 | $355,600 | $155,600 | $200,000 |
| 2021 | $5,745 | $333,600 | $145,400 | $188,200 |
| 2020 | $5,847 | $318,300 | $137,400 | $180,900 |
| 2019 | $5,908 | $303,600 | $127,100 | $176,500 |
| 2018 | $5,794 | $280,300 | $109,600 | $170,700 |
| 2017 | $5,674 | $271,500 | $109,600 | $161,900 |
| 2016 | $4,857 | $247,300 | $98,600 | $148,700 |
| 2015 | $4,530 | $237,400 | $94,600 | $142,800 |
| 2014 | $4,456 | $237,400 | $94,600 | $142,800 |
Source: Public Records
Map
Nearby Homes
- 12 Hamilton Way
- 38 Stephen Dr
- 5 Brookville Ave
- 719 S Franklin St Unit L Block 1
- 719 S Franklin St Unit D Block 1
- 719 S Franklin St Unit C Block 1
- 68 Spring St
- 261 Jon Dr
- 18 Brookfield Dr
- 28 Border Rd
- 55 Border Rd
- 63 Juniper Rd
- 285 Hovendon Ave
- 170 Elsie Rd
- 13 Mayflower Rd
- 29 Belair Dr
- 690 N Quincy St
- 279 Howard St
- 60 Bonney St
- 25 Valley Rd