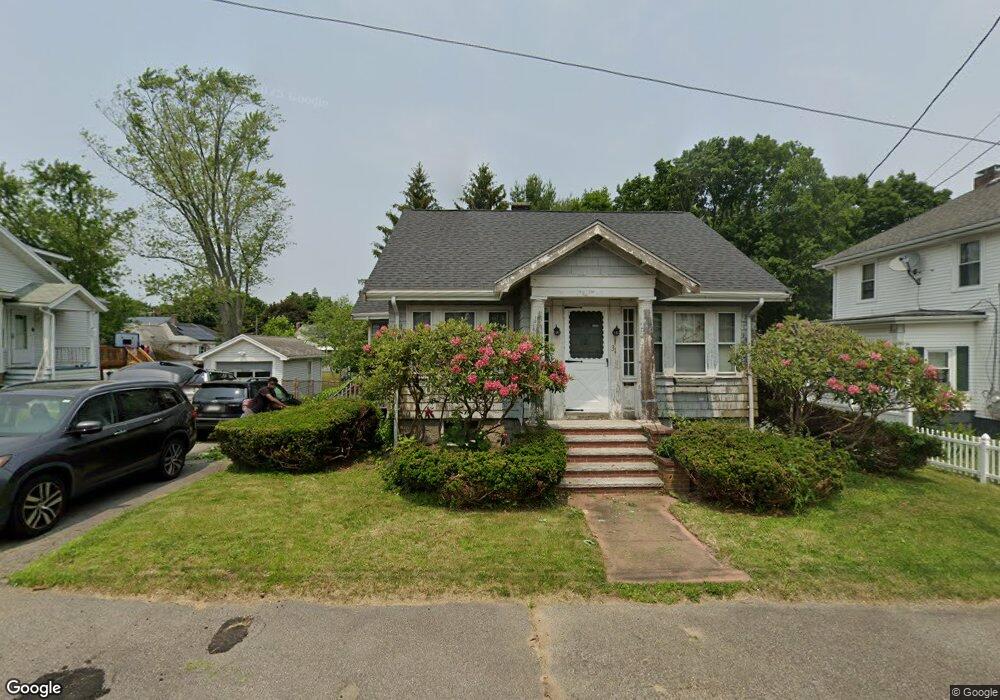
31 Vesey St Brockton, MA 02301
Clifton Heights NeighborhoodEstimated Value: $405,000 - $464,000
1
Bed
1
Bath
1,130
Sq Ft
$376/Sq Ft
Est. Value
About This Home
This home is located at 31 Vesey St, Brockton, MA 02301 and is currently estimated at $425,260, approximately $376 per square foot. 31 Vesey St is a home located in Plymouth County with nearby schools including Gilmore Elementary School, John F. Kennedy Elementary School, and Davis K-8 School.
Ownership History
Date
Name
Owned For
Owner Type
Purchase Details
Closed on
Aug 21, 1998
Sold by
Goeres-Burton Jane M
Bought by
Mackenzie David E and Driscoll Melanie A
Current Estimated Value
Home Financials for this Owner
Home Financials are based on the most recent Mortgage that was taken out on this home.
Original Mortgage
$120,300
Interest Rate
6.86%
Mortgage Type
Purchase Money Mortgage
Purchase Details
Closed on
Jul 2, 1987
Sold by
R R Hennessey By Cv
Bought by
Goeres Louis F
Create a Home Valuation Report for This Property
The Home Valuation Report is an in-depth analysis detailing your home's value as well as a comparison with similar homes in the area
Home Values in the Area
Average Home Value in this Area
Purchase History
| Date | Buyer | Sale Price | Title Company |
|---|---|---|---|
| Mackenzie David E | $120,600 | -- | |
| Goeres Louis F | $106,000 | -- |
Source: Public Records
Mortgage History
| Date | Status | Borrower | Loan Amount |
|---|---|---|---|
| Open | Goeres Louis F | $120,000 | |
| Closed | Goeres Louis F | $40,000 | |
| Closed | Goeres Louis F | $120,300 | |
| Previous Owner | Goeres Louis F | $75,200 |
Source: Public Records
Tax History
| Year | Tax Paid | Tax Assessment Tax Assessment Total Assessment is a certain percentage of the fair market value that is determined by local assessors to be the total taxable value of land and additions on the property. | Land | Improvement |
|---|---|---|---|---|
| 2025 | $4,224 | $348,800 | $140,100 | $208,700 |
| 2024 | $4,099 | $341,000 | $140,100 | $200,900 |
| 2023 | $4,091 | $315,200 | $104,500 | $210,700 |
| 2022 | $3,821 | $273,500 | $95,000 | $178,500 |
| 2021 | $3,654 | $252,000 | $78,900 | $173,100 |
| 2020 | $3,447 | $227,500 | $73,900 | $153,600 |
| 2019 | $3,235 | $208,200 | $72,100 | $136,100 |
| 2018 | $2,873 | $178,900 | $72,100 | $106,800 |
| 2017 | $2,689 | $167,000 | $72,100 | $94,900 |
| 2016 | $2,717 | $156,500 | $69,900 | $86,600 |
| 2015 | $2,505 | $138,000 | $69,900 | $68,100 |
| 2014 | $2,384 | $131,500 | $69,900 | $61,600 |
Source: Public Records
Map
Nearby Homes
Your Personal Tour Guide
Ask me questions while you tour the home.