Estimated Value: $246,000 - $348,000
3
Beds
1
Bath
1,179
Sq Ft
$256/Sq Ft
Est. Value
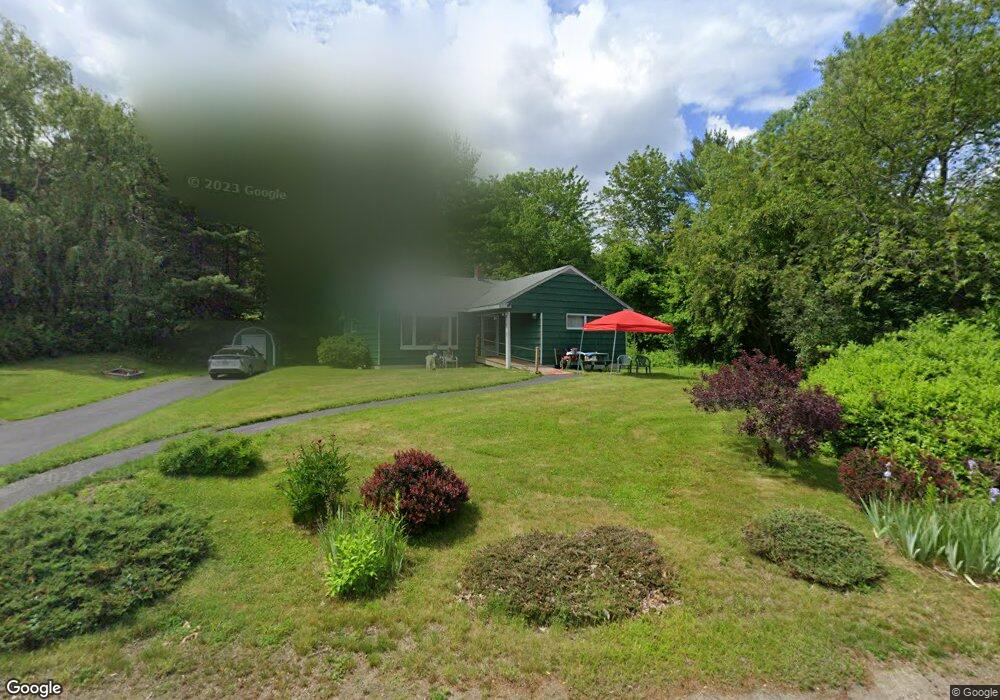
About This Home
This home is located at 31 Webber Ave, Bath, ME 04530 and is currently estimated at $301,682, approximately $255 per square foot. 31 Webber Ave is a home located in Sagadahoc County with nearby schools including Morse High School and Hyde School.
Ownership History
Date
Name
Owned For
Owner Type
Purchase Details
Closed on
Aug 11, 2025
Sold by
Macneil Sylvia P Est and Macneil
Bought by
Campbell James A and Macneil Doreen D
Current Estimated Value
Home Financials for this Owner
Home Financials are based on the most recent Mortgage that was taken out on this home.
Original Mortgage
$203,500
Outstanding Balance
$203,325
Interest Rate
6.77%
Mortgage Type
New Conventional
Estimated Equity
$98,357
Purchase Details
Closed on
Jul 27, 2021
Sold by
Macneil Franklin R Est and Macneil
Bought by
Macneil Sylvia P
Create a Home Valuation Report for This Property
The Home Valuation Report is an in-depth analysis detailing your home's value as well as a comparison with similar homes in the area
Home Values in the Area
Average Home Value in this Area
Purchase History
| Date | Buyer | Sale Price | Title Company |
|---|---|---|---|
| Campbell James A | $245,000 | -- | |
| Campbell James A | $245,000 | -- | |
| Macneil Sylvia P | -- | None Available | |
| Macneil Sylvia P | -- | None Available |
Source: Public Records
Mortgage History
| Date | Status | Borrower | Loan Amount |
|---|---|---|---|
| Open | Campbell James A | $203,500 | |
| Closed | Campbell James A | $203,500 |
Source: Public Records
Tax History Compared to Growth
Tax History
| Year | Tax Paid | Tax Assessment Tax Assessment Total Assessment is a certain percentage of the fair market value that is determined by local assessors to be the total taxable value of land and additions on the property. | Land | Improvement |
|---|---|---|---|---|
| 2024 | $3,719 | $225,400 | $62,800 | $162,600 |
| 2023 | $3,179 | $188,100 | $51,000 | $137,100 |
| 2022 | $3,115 | $152,700 | $40,200 | $112,500 |
| 2021 | $3,100 | $152,700 | $40,200 | $112,500 |
| 2020 | $3,054 | $152,700 | $40,200 | $112,500 |
| 2019 | $3,023 | $152,700 | $40,200 | $112,500 |
| 2018 | $3,117 | $143,000 | $40,200 | $102,800 |
| 2017 | $3,053 | $143,000 | $40,200 | $102,800 |
| 2016 | $3,017 | $143,000 | $40,200 | $102,800 |
| 2015 | $2,960 | $143,000 | $40,200 | $102,800 |
| 2014 | $2,889 | $143,000 | $40,200 | $102,800 |
| 2013 | $2,809 | $143,000 | $40,200 | $102,800 |
Source: Public Records
Map
Nearby Homes