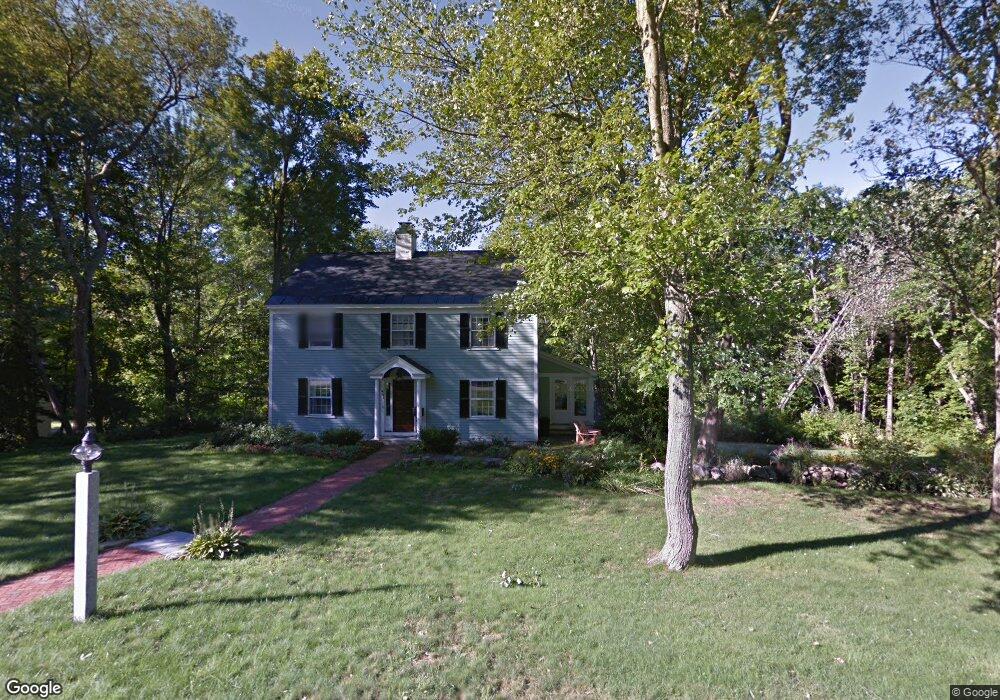
31 Westbourne Rd Concord, NH 03301
North End NeighborhoodEstimated Value: $662,000 - $761,000
3
Beds
3
Baths
1,872
Sq Ft
$377/Sq Ft
Est. Value
About This Home
This home is located at 31 Westbourne Rd, Concord, NH 03301 and is currently estimated at $706,434, approximately $377 per square foot. 31 Westbourne Rd is a home located in Merrimack County with nearby schools including Christa McAuliffe School, Rundlett Middle School, and Concord High School.
Ownership History
Date
Name
Owned For
Owner Type
Purchase Details
Closed on
Feb 15, 2024
Sold by
Caccia Stephen P and Caccia Christine E
Bought by
Weston Karen G Ret and Weston
Current Estimated Value
Home Financials for this Owner
Home Financials are based on the most recent Mortgage that was taken out on this home.
Original Mortgage
$300,000
Outstanding Balance
$294,708
Interest Rate
6.62%
Mortgage Type
Purchase Money Mortgage
Estimated Equity
$411,726
Purchase Details
Closed on
May 16, 1997
Sold by
Potter Benjamin E
Bought by
Caccia Stephen P and Caccia Christine E
Home Financials for this Owner
Home Financials are based on the most recent Mortgage that was taken out on this home.
Original Mortgage
$130,000
Interest Rate
8.12%
Mortgage Type
Purchase Money Mortgage
Create a Home Valuation Report for This Property
The Home Valuation Report is an in-depth analysis detailing your home's value as well as a comparison with similar homes in the area
Home Values in the Area
Average Home Value in this Area
Purchase History
| Date | Buyer | Sale Price | Title Company |
|---|---|---|---|
| Weston Karen G Ret | $640,000 | None Available | |
| Caccia Stephen P | $169,000 | -- |
Source: Public Records
Mortgage History
| Date | Status | Borrower | Loan Amount |
|---|---|---|---|
| Open | Weston Karen G Ret | $300,000 | |
| Previous Owner | Caccia Stephen P | $130,000 |
Source: Public Records
Tax History Compared to Growth
Tax History
| Year | Tax Paid | Tax Assessment Tax Assessment Total Assessment is a certain percentage of the fair market value that is determined by local assessors to be the total taxable value of land and additions on the property. | Land | Improvement |
|---|---|---|---|---|
| 2024 | $11,389 | $411,300 | $194,700 | $216,600 |
| 2023 | $10,996 | $409,400 | $194,700 | $214,700 |
| 2022 | $10,625 | $410,400 | $194,700 | $215,700 |
| 2021 | $10,211 | $406,500 | $194,700 | $211,800 |
| 2020 | $9,829 | $367,300 | $163,000 | $204,300 |
| 2019 | $9,748 | $350,900 | $163,000 | $187,900 |
| 2018 | $9,503 | $337,100 | $155,500 | $181,600 |
| 2017 | $9,362 | $331,500 | $155,500 | $176,000 |
| 2016 | $9,029 | $326,300 | $155,500 | $170,800 |
| 2015 | $8,352 | $305,500 | $127,800 | $177,700 |
| 2014 | $8,169 | $305,500 | $127,800 | $177,700 |
| 2013 | -- | $303,000 | $127,800 | $175,200 |
| 2012 | -- | $301,900 | $127,800 | $174,100 |
Source: Public Records
Map
Nearby Homes
- 17 Essex St
- 2 Kensington Rd
- 1 Kensington Rd
- 11 Pleasant View Ave
- 119 Rumford St
- 30 Jackson St
- 54 Pleasant St Unit 8
- 157 Rumford St
- 8 Tremont St
- 10 N State St
- 11 Washington St
- 25 Fayette St
- 37 Thorndike St
- 45 Little Pond Rd
- 75 S State St
- 14-16 Perley St
- 14 Downing St
- 8-10 Granite Ave
- 6 Herbert St
- 2 Herbert St