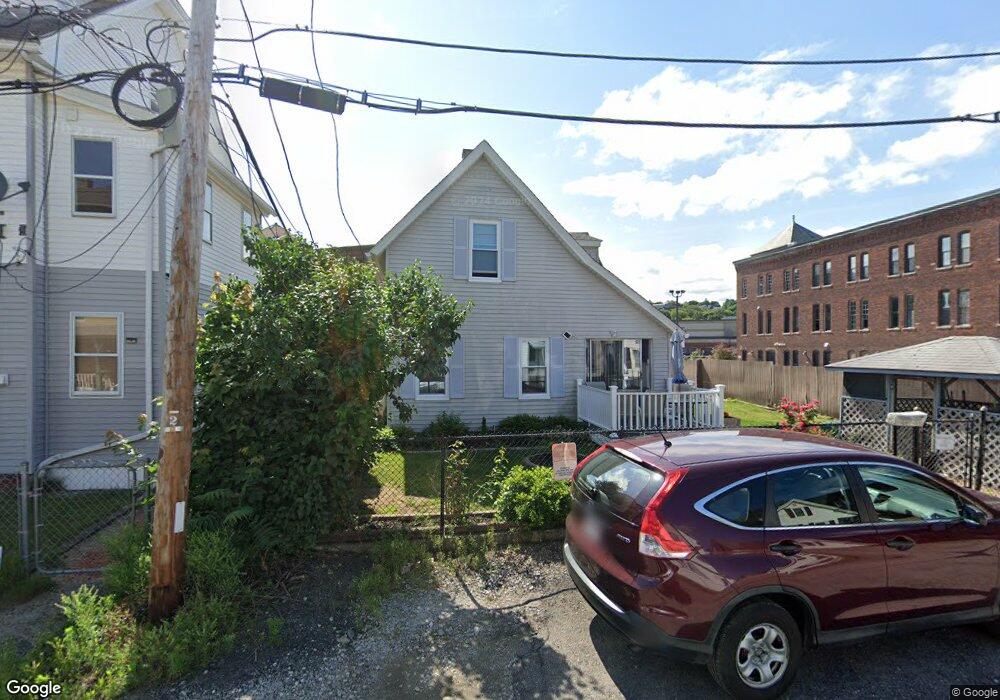
31 Woodward St Worcester, MA 01610
South Worcester NeighborhoodEstimated Value: $327,000 - $375,000
3
Beds
1
Bath
1,097
Sq Ft
$316/Sq Ft
Est. Value
About This Home
This home is located at 31 Woodward St, Worcester, MA 01610 and is currently estimated at $346,605, approximately $315 per square foot. 31 Woodward St is a home located in Worcester County with nearby schools including Jacob Hiatt Magnet School, Chandler Magnet, and University Park Campus School.
Ownership History
Date
Name
Owned For
Owner Type
Purchase Details
Closed on
Oct 10, 2025
Sold by
Giacobbi Mary L and Servbank Na
Bought by
Mk3 Properties Llc
Current Estimated Value
Purchase Details
Closed on
Sep 2, 1994
Sold by
Dunn Richard W and Dunn Emma
Bought by
Giacobbi Mary and Mallett Patricia
Create a Home Valuation Report for This Property
The Home Valuation Report is an in-depth analysis detailing your home's value as well as a comparison with similar homes in the area
Home Values in the Area
Average Home Value in this Area
Purchase History
| Date | Buyer | Sale Price | Title Company |
|---|---|---|---|
| Mk3 Properties Llc | $204,000 | -- | |
| Giacobbi Mary | $57,000 | -- |
Source: Public Records
Mortgage History
| Date | Status | Borrower | Loan Amount |
|---|---|---|---|
| Previous Owner | Giacobbi Mary | $224,166 | |
| Previous Owner | Giacobbi Mary | $97,000 | |
| Previous Owner | Giacobbi Mary | $80,800 |
Source: Public Records
Tax History
| Year | Tax Paid | Tax Assessment Tax Assessment Total Assessment is a certain percentage of the fair market value that is determined by local assessors to be the total taxable value of land and additions on the property. | Land | Improvement |
|---|---|---|---|---|
| 2025 | $3,822 | $289,800 | $68,800 | $221,000 |
| 2024 | $3,630 | $264,000 | $68,800 | $195,200 |
| 2023 | $3,505 | $244,400 | $59,800 | $184,600 |
| 2022 | $3,249 | $213,600 | $47,800 | $165,800 |
| 2021 | $3,111 | $191,100 | $38,300 | $152,800 |
| 2020 | $2,934 | $172,600 | $38,000 | $134,600 |
| 2019 | $2,801 | $155,600 | $33,200 | $122,400 |
| 2018 | $2,782 | $147,100 | $33,200 | $113,900 |
| 2017 | $2,635 | $137,100 | $33,200 | $103,900 |
| 2016 | $2,667 | $129,400 | $24,500 | $104,900 |
| 2015 | $2,597 | $129,400 | $24,500 | $104,900 |
| 2014 | $2,528 | $129,400 | $24,500 | $104,900 |
Source: Public Records
Map
Nearby Homes
- 120 Grand St
- 103 Illinois St
- 20 Washburn St
- 52 Richards St
- 56 Richards St
- 54 Richards St
- 607 Cambridge St Unit 4
- 28 Richards St
- 15 Gardner St
- 14 Hancock St
- 7 Wyman St
- 5 Freeland Terrace
- 12 Stoneland Rd
- 5 Ripley Place
- 5 Stoneland Rd
- 3A Gediminas St
- 6 Epworth St
- 172 Perry Ave Unit 1A
- 172 Perry Ave Unit 2B
- 4 Maxwell Ct
Your Personal Tour Guide
Ask me questions while you tour the home.