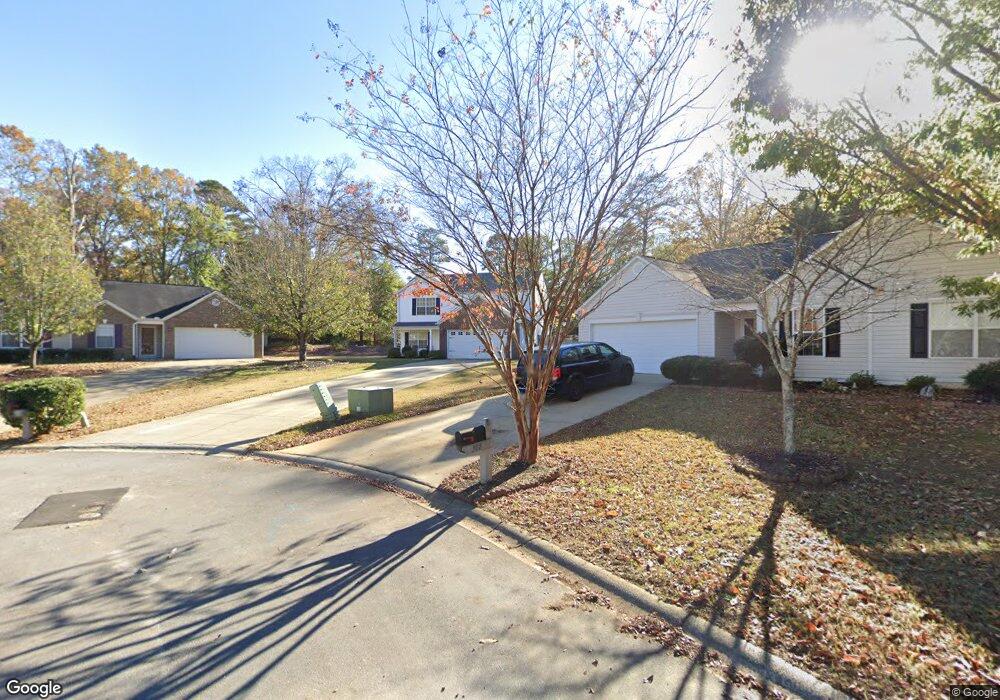
310 Appleton Ln Mauldin, SC 29662
Estimated Value: $326,000 - $337,000
4
Beds
3
Baths
2,152
Sq Ft
$154/Sq Ft
Est. Value
About This Home
This home is located at 310 Appleton Ln, Mauldin, SC 29662 and is currently estimated at $332,033, approximately $154 per square foot. 310 Appleton Ln is a home located in Greenville County with nearby schools including Greenbrier Elementary School, Hillcrest Middle School, and Mauldin High School.
Ownership History
Date
Name
Owned For
Owner Type
Purchase Details
Closed on
Jun 30, 2015
Sold by
Acker Anthoney M and Cohen Sonya D
Bought by
Bell Chantai Z
Current Estimated Value
Home Financials for this Owner
Home Financials are based on the most recent Mortgage that was taken out on this home.
Original Mortgage
$142,405
Outstanding Balance
$109,593
Interest Rate
3.89%
Mortgage Type
Future Advance Clause Open End Mortgage
Estimated Equity
$222,440
Purchase Details
Closed on
Jan 23, 2015
Sold by
Acker Anthony M
Bought by
Acker Anthony M and Cohen Sonya D
Purchase Details
Closed on
Jan 30, 2013
Sold by
Gutierrez Jorge I and Gutierrez Teresita M
Bought by
Acker Anthony M
Home Financials for this Owner
Home Financials are based on the most recent Mortgage that was taken out on this home.
Original Mortgage
$118,750
Interest Rate
3.25%
Mortgage Type
FHA
Purchase Details
Closed on
Apr 18, 2002
Sold by
Centex International Inc Successor By Me
Bought by
Gutierrez Jorge I
Create a Home Valuation Report for This Property
The Home Valuation Report is an in-depth analysis detailing your home's value as well as a comparison with similar homes in the area
Home Values in the Area
Average Home Value in this Area
Purchase History
| Date | Buyer | Sale Price | Title Company |
|---|---|---|---|
| Bell Chantai Z | $149,900 | -- | |
| Acker Anthony M | -- | -- | |
| Acker Anthony M | $124,750 | -- | |
| Gutierrez Jorge I | $129,486 | -- |
Source: Public Records
Mortgage History
| Date | Status | Borrower | Loan Amount |
|---|---|---|---|
| Open | Bell Chantai Z | $142,405 | |
| Previous Owner | Acker Anthony M | $118,750 |
Source: Public Records
Tax History
| Year | Tax Paid | Tax Assessment Tax Assessment Total Assessment is a certain percentage of the fair market value that is determined by local assessors to be the total taxable value of land and additions on the property. | Land | Improvement |
|---|---|---|---|---|
| 2025 | $1,416 | $8,550 | $1,800 | $6,750 |
| 2024 | $1,416 | $7,430 | $1,080 | $6,350 |
| 2023 | $1,356 | $7,430 | $1,080 | $6,350 |
| 2022 | $1,278 | $7,430 | $1,080 | $6,350 |
| 2021 | $1,278 | $7,430 | $1,080 | $6,350 |
| 2020 | $1,178 | $6,460 | $940 | $5,520 |
| 2019 | $1,179 | $6,460 | $940 | $5,520 |
| 2018 | $1,176 | $6,460 | $940 | $5,520 |
| 2017 | $1,176 | $6,460 | $940 | $5,520 |
| 2016 | $1,132 | $161,500 | $23,500 | $138,000 |
| 2015 | $1,132 | $161,500 | $23,500 | $138,000 |
| 2014 | $1,125 | $161,500 | $23,500 | $138,000 |
Source: Public Records
Map
Nearby Homes
- 248 Paperbark Dr
- 245 Paperbark Dr
- 249 Paperbark Dr
- 428 Fiery Rd
- 430 Fiery Rd
- 251 Paperbark Dr
- 253 Paperbark Dr
- 310 Scarlet Leaf Ln
- 9 Colombard Ct
- 308 Scarlet Leaf Ln
- 306 Scarlet Leaf Ln
- 304 Scarlet Leaf Ln
- 302 Scarlet Leaf Ln
- 315 Scarlet Leaf Way
- 300 Scarlet Leaf Ln
- 422 Fiery Rd
- 309 Scarlet Leaf Ln
- 107 Scarlet Leaf Ln
- 426 Fiery Rd
- 305 Scarlet Leaf Ln
- 312 Appleton Ln
- 308 Appleton Ln
- 314 Appleton Ln
- 306 Appleton Ln
- 309 Appleton Ln
- 304 Appleton Ln
- 305 Appleton Ln
- 307 Appleton Ln
- 208 Manhassett Ct
- 302 Appleton Ln
- 203 Manhassett Ct
- 605 Ashmore Bridge Rd
- 102 Merlot Ct
- 204 Manhassett Ct
- 100 Merlot Ct
- 104 Merlot Ct
- 300 Appleton Ln
- 215 Montauk Dr
- 609 Ashmore Bridge Rd
- 202 Manhassett Ct
Your Personal Tour Guide
Ask me questions while you tour the home.