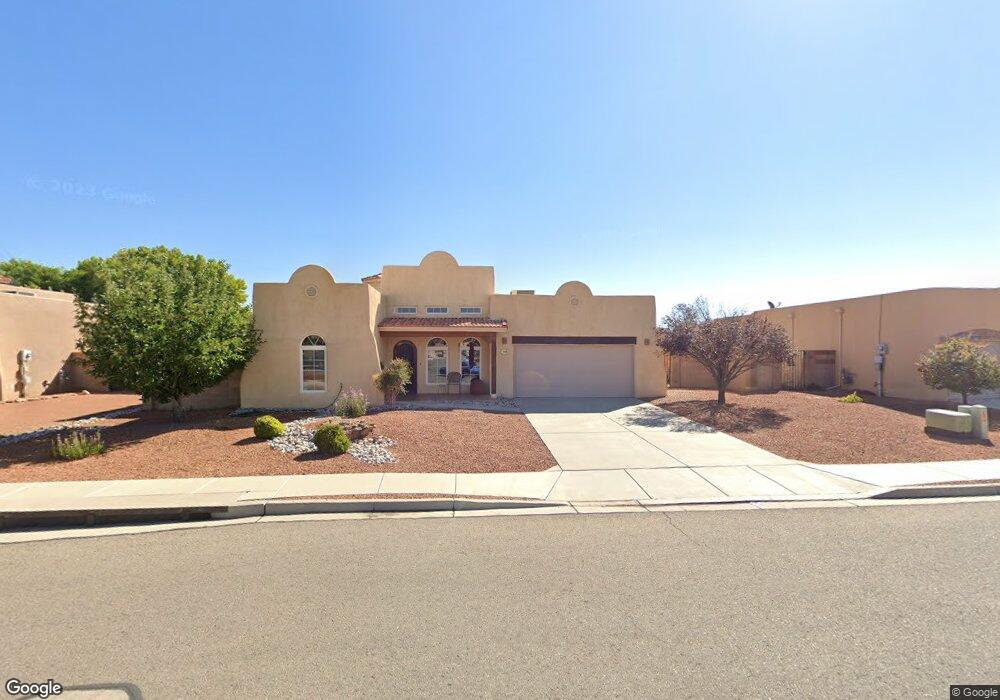
310 Cll Consuelo NE Los Lunas, NM 87031
Estimated Value: $335,989 - $369,000
3
Beds
2
Baths
1,753
Sq Ft
$201/Sq Ft
Est. Value
About This Home
This home is located at 310 Cll Consuelo NE, Los Lunas, NM 87031 and is currently estimated at $352,497, approximately $201 per square foot. 310 Cll Consuelo NE is a home located in Valencia County with nearby schools including Los Lunas Elementary School, Los Lunas Middle School, and Los Lunas High School.
Ownership History
Date
Name
Owned For
Owner Type
Purchase Details
Closed on
Sep 30, 2021
Sold by
Twaddell Miles E and Twaddell Joanne C
Bought by
Schroeder Kathryn A
Current Estimated Value
Purchase Details
Closed on
May 4, 2020
Sold by
Hajner Barbara M
Bought by
Twaddell Miles E and Twaddell Joanne C
Home Financials for this Owner
Home Financials are based on the most recent Mortgage that was taken out on this home.
Original Mortgage
$232,064
Interest Rate
3.6%
Mortgage Type
VA
Purchase Details
Closed on
Dec 21, 2006
Sold by
Highlander Development Llc
Bought by
Hajner Barbara M
Purchase Details
Closed on
Jul 21, 2006
Sold by
Baca Consuelo E
Bought by
Highlander Development Llc
Home Financials for this Owner
Home Financials are based on the most recent Mortgage that was taken out on this home.
Original Mortgage
$313,600
Interest Rate
6.62%
Mortgage Type
Construction
Create a Home Valuation Report for This Property
The Home Valuation Report is an in-depth analysis detailing your home's value as well as a comparison with similar homes in the area
Home Values in the Area
Average Home Value in this Area
Purchase History
| Date | Buyer | Sale Price | Title Company |
|---|---|---|---|
| Schroeder Kathryn A | -- | Fidelity National Ttl Ins Co | |
| Twaddell Miles E | -- | Fidelity National Ttl Ins Co | |
| Hajner Barbara M | -- | None Available | |
| Highlander Development Llc | -- | None Available |
Source: Public Records
Mortgage History
| Date | Status | Borrower | Loan Amount |
|---|---|---|---|
| Previous Owner | Twaddell Miles E | $232,064 | |
| Previous Owner | Highlander Development Llc | $313,600 |
Source: Public Records
Tax History Compared to Growth
Tax History
| Year | Tax Paid | Tax Assessment Tax Assessment Total Assessment is a certain percentage of the fair market value that is determined by local assessors to be the total taxable value of land and additions on the property. | Land | Improvement |
|---|---|---|---|---|
| 2024 | $3,474 | $90,234 | $14,167 | $76,067 |
| 2023 | $3,445 | $90,000 | $14,167 | $75,833 |
| 2022 | $3,393 | $90,000 | $14,167 | $75,833 |
| 2021 | $2,843 | $76,907 | $14,592 | $62,315 |
| 2020 | $2,926 | $76,083 | $14,569 | $61,514 |
| 2019 | $2,940 | $76,083 | $14,569 | $61,514 |
| 2018 | $2,895 | $76,083 | $14,569 | $61,514 |
| 2017 | $2,782 | $74,592 | $14,569 | $60,023 |
| 2016 | $2,686 | $72,420 | $14,569 | $57,851 |
| 2015 | -- | $70,311 | $14,569 | $55,742 |
| 2013 | -- | $66,275 | $14,569 | $51,706 |
| 2011 | -- | $193,035 | $42,435 | $150,600 |
Source: Public Records
Map
Nearby Homes
- 350 Calle Consuelo NE
- 427 Kingsbury Cir NE
- 466 Dennis Ct NE
- 360 Taylor Rd NE
- 403 Dennis Dr NE
- 612 Calle Don Demetrio NE
- 235 Luna Ave NE
- 0 Rio Del Oro: Lot: 40 Unit 12 1073698
- 485 Diana Dr
- 411 Schmidt Place SW
- 0 Cinder Ln
- 344 Los Lentes Rd SE
- 325 Verde Dr SW
- 251 Sichler Rd SW Unit B
- 414 Adeline Ave SW
- 435 Adeline Ave SW
- 461 Los Lentes Rd SE
- 251 Trujillo St NE
- 500 Calle de Wences
- 215 Tren Rd
- 310 Calle Consuelo NE
- 320 Calle Consuelo NE
- 461 Dennis Ct NE
- 300 Calle Consuelo NE
- 455 Dennis Ct NE
- 330 Cll Consuelo NE
- 383 Calle Adelaida NE
- 290 Calle Consuelo NE
- 451 Dennis Ct NE
- 380 Calle Adelaida NE
- 401 Kingsbury Cir NE
- 466 Dennis Dr NE
- 340 Calle Consuelo NE
- 370 Calle Felipe SW
- 445 Dennis Ct NE
- 373 Calle Adelaida NE
- 370 Calle Felipe NE
- 280 Calle Consuelo NE
- 411 Kingsbury Cir NE
- 370 Calle Adelaida NE