310 Corral de Tierra Rd Salinas, CA 93908
Corral de Tierra NeighborhoodEstimated Value: $1,036,000 - $1,446,000
3
Beds
2
Baths
1,851
Sq Ft
$650/Sq Ft
Est. Value
About This Home
This home is located at 310 Corral de Tierra Rd, Salinas, CA 93908 and is currently estimated at $1,202,304, approximately $649 per square foot. 310 Corral de Tierra Rd is a home located in Monterey County with nearby schools including Washington Elementary School, Toro Park Elementary School, and San Benancio Middle School.
Ownership History
Date
Name
Owned For
Owner Type
Purchase Details
Closed on
Jun 15, 2020
Sold by
Deroza Daniel J and Deroza Nicolette
Bought by
Deroza Daniel J and Deroza Nicolette P
Current Estimated Value
Purchase Details
Closed on
Jun 26, 2012
Sold by
Allen Roland Steven Eugene and Allen Roland Gerald
Bought by
Deroza Daniel J and Deroza Nicolette
Home Financials for this Owner
Home Financials are based on the most recent Mortgage that was taken out on this home.
Original Mortgage
$674,500
Outstanding Balance
$467,357
Interest Rate
3.75%
Mortgage Type
FHA
Estimated Equity
$734,947
Purchase Details
Closed on
Jul 18, 2005
Sold by
Allen Roland Steven Eugene and Allen Roland Gerald
Bought by
Allen Roland Steven Eugene and Allen Roland Gerald
Purchase Details
Closed on
Mar 9, 1995
Sold by
Harpster John H and Harpster Bette K
Bought by
Harpster John Howard and Harpster Bette Kay
Create a Home Valuation Report for This Property
The Home Valuation Report is an in-depth analysis detailing your home's value as well as a comparison with similar homes in the area
Home Values in the Area
Average Home Value in this Area
Purchase History
| Date | Buyer | Sale Price | Title Company |
|---|---|---|---|
| Deroza Daniel J | -- | None Available | |
| Deroza Daniel J | $735,000 | Chicago Title Company | |
| Allen Roland Steven Eugene | -- | -- | |
| Allen Roland Steven Eugene | -- | -- | |
| Allen Roland Steven Eugene | -- | -- | |
| Allen Roland Steven Eugene | -- | -- | |
| Harpster John Howard | -- | -- |
Source: Public Records
Mortgage History
| Date | Status | Borrower | Loan Amount |
|---|---|---|---|
| Open | Deroza Daniel J | $674,500 |
Source: Public Records
Tax History Compared to Growth
Tax History
| Year | Tax Paid | Tax Assessment Tax Assessment Total Assessment is a certain percentage of the fair market value that is determined by local assessors to be the total taxable value of land and additions on the property. | Land | Improvement |
|---|---|---|---|---|
| 2025 | $5,763 | $535,660 | $246,282 | $289,378 |
| 2024 | $5,763 | $525,157 | $241,453 | $283,704 |
| 2023 | $5,555 | $514,861 | $236,719 | $278,142 |
| 2022 | $5,594 | $504,767 | $232,078 | $272,689 |
| 2021 | $5,350 | $494,871 | $227,528 | $267,343 |
| 2020 | $5,233 | $489,797 | $225,195 | $264,602 |
| 2019 | $5,210 | $480,194 | $220,780 | $259,414 |
| 2018 | $5,098 | $470,779 | $216,451 | $254,328 |
| 2017 | $5,173 | $461,549 | $212,207 | $249,342 |
| 2016 | $5,016 | $452,500 | $208,047 | $244,453 |
| 2015 | $4,965 | $445,704 | $204,922 | $240,782 |
| 2014 | $4,800 | $436,974 | $200,908 | $236,066 |
Source: Public Records
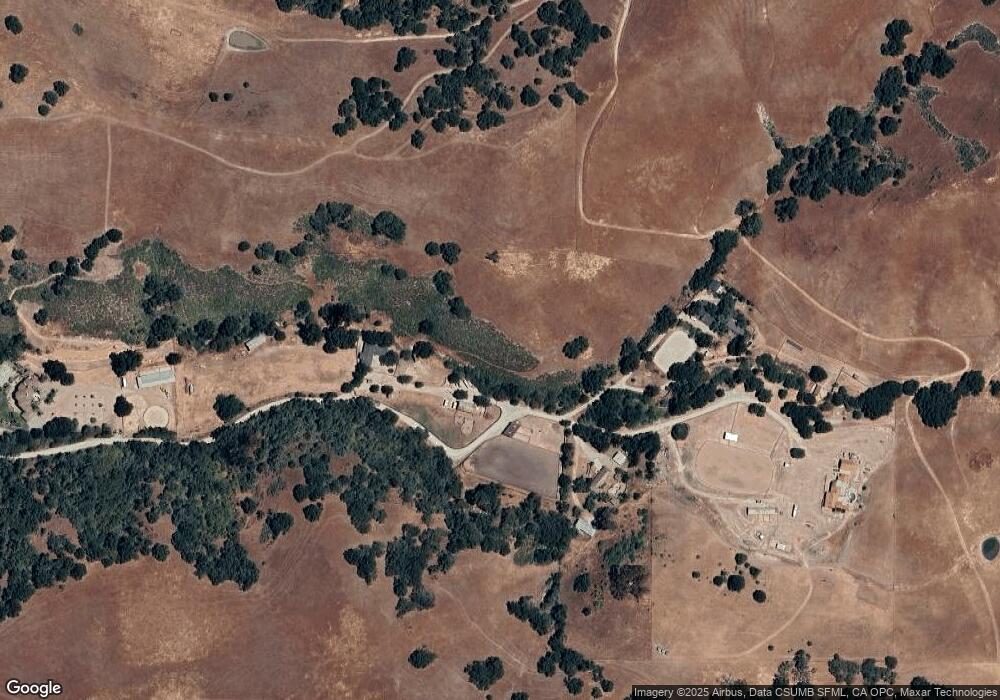
Map
Nearby Homes
- 0 Corral de Tierra Rd
- 382 Corral de Tierra Rd
- 274 Corral de Tierra Rd
- 397 B Corral de Tierra Rd
- 17 Calera Canyon Rd
- 15847 Pleasant Valley Ln
- 442 Corral de Tierra Rd
- 27412 Vista Del Toro Place
- 453 Corral de Tierra Rd
- 25603 Creekview Cir
- 27765 Mesa Del Toro Rd
- 180 San Benancio Rd
- 89 Robley Rd
- 108 San Benancio Rd
- 0 Laureles Grade
- 25317 Camino de Chamisal
- 13525 Paseo Terrano
- 529 Corral de Tierra Rd
- 13500 Paseo Terrano
- 14105 Mountain Quail Rd
- 310 Corral de Tierra Rd Unit RD
- 289 Corral de Tierra Rd
- 311 Corral de Tierra Rd
- 309 Corral de Tierra Rd
- 317 Corral de Tierra Rd
- 321 Corral de Tierra Rd
- 368 Corral de Tierra Rd
- 379 Corral de Tierra Rd
- 381A Corral de Tierra Rd
- 381 Corral de Tierra Rd Unit A
- 381 Corral de Tierra Rd
- 00 Corral de Tierra Rd
- 376 Corral de Tierra Rd
- 378 Corral de Tierra Rd Unit A
- 378 Corral de Tierra Rd
- 295 Corral de Tierra Rd
- 295 Corral de Tierra Rd Unit G
- 295 Corral de Tierra Rd Unit F
- 295 Corral de Tierra Rd Unit E
- 295 Corral de Tierra Rd