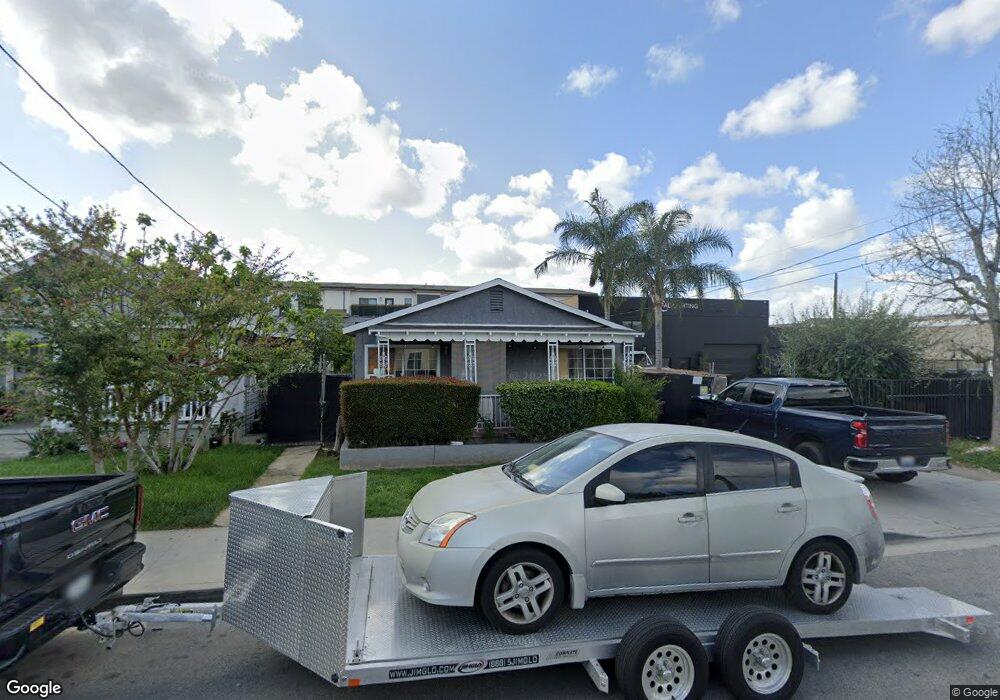
310 E 2nd Ave La Habra, CA 90631
Estimated Value: $609,000 - $1,044,000
3
Beds
2
Baths
1,488
Sq Ft
$530/Sq Ft
Est. Value
About This Home
This home is located at 310 E 2nd Ave, La Habra, CA 90631 and is currently estimated at $788,058, approximately $529 per square foot. 310 E 2nd Ave is a home located in Orange County with nearby schools including El Cerrito Elementary School, Arbolita Elementary School, and Washington Middle School.
Ownership History
Date
Name
Owned For
Owner Type
Purchase Details
Closed on
Aug 3, 2017
Sold by
Sanchez Carlos I
Bought by
Sanchez Carlos I
Current Estimated Value
Home Financials for this Owner
Home Financials are based on the most recent Mortgage that was taken out on this home.
Original Mortgage
$172,000
Outstanding Balance
$141,899
Interest Rate
3.9%
Mortgage Type
Purchase Money Mortgage
Estimated Equity
$646,159
Purchase Details
Closed on
Jul 11, 2017
Sold by
La Habra Partners Llc
Bought by
Sanchez Carlos I
Home Financials for this Owner
Home Financials are based on the most recent Mortgage that was taken out on this home.
Original Mortgage
$172,000
Outstanding Balance
$141,899
Interest Rate
3.9%
Mortgage Type
Purchase Money Mortgage
Estimated Equity
$646,159
Purchase Details
Closed on
Jul 29, 2009
Sold by
Sanchez Elizabeth and Sanchez Carlos I
Bought by
La Habra Partners Llc
Purchase Details
Closed on
Aug 14, 2006
Sold by
Sanchez Elizabeth
Bought by
Sanchez Ruth
Create a Home Valuation Report for This Property
The Home Valuation Report is an in-depth analysis detailing your home's value as well as a comparison with similar homes in the area
Home Values in the Area
Average Home Value in this Area
Purchase History
| Date | Buyer | Sale Price | Title Company |
|---|---|---|---|
| Sanchez Carlos I | -- | Old Republic Title Co | |
| Sanchez Carlos I | -- | None Available | |
| La Habra Partners Llc | -- | None Available | |
| Sanchez Ruth | -- | Accommodation |
Source: Public Records
Mortgage History
| Date | Status | Borrower | Loan Amount |
|---|---|---|---|
| Open | Sanchez Carlos I | $172,000 |
Source: Public Records
Tax History
| Year | Tax Paid | Tax Assessment Tax Assessment Total Assessment is a certain percentage of the fair market value that is determined by local assessors to be the total taxable value of land and additions on the property. | Land | Improvement |
|---|---|---|---|---|
| 2025 | $5,445 | $474,459 | $439,232 | $35,227 |
| 2024 | $5,445 | $465,156 | $430,619 | $34,537 |
| 2023 | $5,830 | $503,076 | $422,176 | $80,900 |
| 2022 | $5,771 | $493,212 | $413,898 | $79,314 |
| 2021 | $5,678 | $483,542 | $405,783 | $77,759 |
| 2020 | $5,624 | $478,584 | $401,622 | $76,962 |
| 2019 | $5,468 | $469,200 | $393,747 | $75,453 |
| 2018 | $5,376 | $460,000 | $386,026 | $73,974 |
| 2017 | $3,207 | $261,369 | $231,341 | $30,028 |
| 2016 | $3,133 | $256,245 | $226,805 | $29,440 |
| 2015 | $3,045 | $252,396 | $223,398 | $28,998 |
| 2014 | $2,956 | $247,452 | $219,022 | $28,430 |
Source: Public Records
Map
Nearby Homes
- 355 S Cypress St
- 302 E Bridenbecker Ave
- 101 W Olive Ave
- 501 S Euclid St
- 236 W La Habra Blvd
- 341 Acacia Ave
- 621 S Olive Ave
- 313 1st St Unit E
- 335 E Francis Ave
- 221 S Valencia St
- 124 S Valencia St Unit 124
- 211 S Valencia St
- 305 N College St
- 601 S Euclid St Unit 4
- 308 S Valencia St
- 1004 E Erna Ave
- 409 W Mountain View Ave Unit 6
- 600 Maple St
- 325 N Sunset St
- 1001 E Lambert Rd Unit 258
Your Personal Tour Guide
Ask me questions while you tour the home.