Estimated Value: $302,000 - $365,000
--
Bed
2
Baths
1,714
Sq Ft
$192/Sq Ft
Est. Value
About This Home
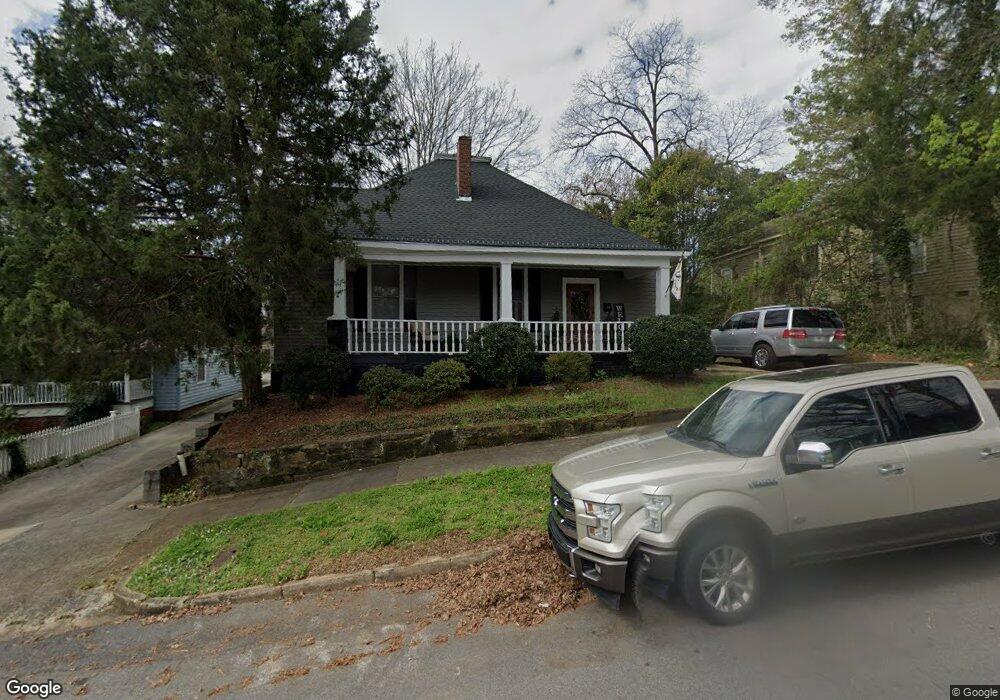
This home is located at 310 E 5th Ave, Rome, GA 30161 and is currently estimated at $328,884, approximately $191 per square foot. 310 E 5th Ave is a home located in Floyd County with nearby schools including Rome High School.
Ownership History
Date
Name
Owned For
Owner Type
Purchase Details
Closed on
Apr 6, 2007
Sold by
Not Provided
Bought by
Walstad Martha B
Current Estimated Value
Purchase Details
Closed on
Nov 17, 1999
Sold by
Levy Elizabeth J & Bedowe Llc
Bought by
Bedowe Llc
Purchase Details
Closed on
Aug 27, 1999
Sold by
Levy Ira D and Levy Elizabeth J
Bought by
Levy Elizabeth J & Bedowe Llc
Purchase Details
Closed on
Nov 5, 1987
Sold by
Dillen Gwynn C and Dillen Robert E
Bought by
Levy Ira D and Levy Elizabeth J
Purchase Details
Closed on
Nov 8, 1985
Sold by
Dillen Gwynn C
Bought by
Dillen Gwynn C and Dillen Robert E
Purchase Details
Closed on
Mar 19, 1985
Sold by
Bradley Claudia I
Bought by
Dillen Gwynn C
Purchase Details
Closed on
Mar 18, 1985
Bought by
P and R
Purchase Details
Closed on
Apr 8, 1983
Sold by
Dunlop Henry Mrs Bessie R
Bought by
Bradley Claudia I
Purchase Details
Closed on
Jan 1, 1901
Bought by
Dunlop Henry Mrs Bessie R
Create a Home Valuation Report for This Property
The Home Valuation Report is an in-depth analysis detailing your home's value as well as a comparison with similar homes in the area
Home Values in the Area
Average Home Value in this Area
Purchase History
| Date | Buyer | Sale Price | Title Company |
|---|---|---|---|
| Walstad Martha B | $112,500 | -- | |
| Bedowe Llc | -- | -- | |
| Levy Elizabeth J & Bedowe Llc | $92,000 | -- | |
| Levy Ira D | $64,000 | -- | |
| Dillen Gwynn C | -- | -- | |
| Dillen Gwynn C | -- | -- | |
| P | $45,000 | -- | |
| Bradley Claudia I | $42,000 | -- | |
| Dunlop Henry Mrs Bessie R | -- | -- |
Source: Public Records
Tax History
| Year | Tax Paid | Tax Assessment Tax Assessment Total Assessment is a certain percentage of the fair market value that is determined by local assessors to be the total taxable value of land and additions on the property. | Land | Improvement |
|---|---|---|---|---|
| 2025 | $5,871 | $164,221 | $19,620 | $144,601 |
| 2024 | $5,871 | $152,488 | $17,836 | $134,652 |
| 2023 | $5,400 | $146,308 | $16,052 | $130,256 |
| 2022 | $4,418 | $121,088 | $13,250 | $107,838 |
| 2021 | $3,227 | $86,980 | $13,250 | $73,730 |
| 2020 | $2,967 | $79,285 | $10,192 | $69,093 |
| 2019 | $2,765 | $74,689 | $10,192 | $64,497 |
| 2018 | $2,595 | $70,094 | $10,192 | $59,902 |
| 2017 | $2,492 | $67,320 | $10,192 | $57,128 |
| 2016 | $2,430 | $65,440 | $10,160 | $55,280 |
| 2015 | $1,565 | $69,320 | $10,160 | $59,160 |
| 2014 | $1,565 | $44,623 | $7,640 | $36,983 |
Source: Public Records
Map
Nearby Homes
- 29 Pear St
- 407 E 3rd St
- 312 E 3rd St
- 501 E 3rd St
- 204 E 5th Ave
- 202 E 4th Ave Unit 5
- 320 E 3rd Ave
- 633 E 3rd St
- 214 E 3rd St
- 138 E 8th Ave Unit 25
- 10 E 3rd Ave
- 1 E 3rd Ave Unit 302
- 8 E 3rd Ave
- 167 Sweet Water Ln
- 0 Brook Valley Ct Unit 10665224
- 0 Brook Valley Ct Unit 7698646
- 2 Coral Ave SW
- 311 Roswell Ave SE
- 102 Smith St NE
- 801 Maple Ave SW
Your Personal Tour Guide
Ask me questions while you tour the home.