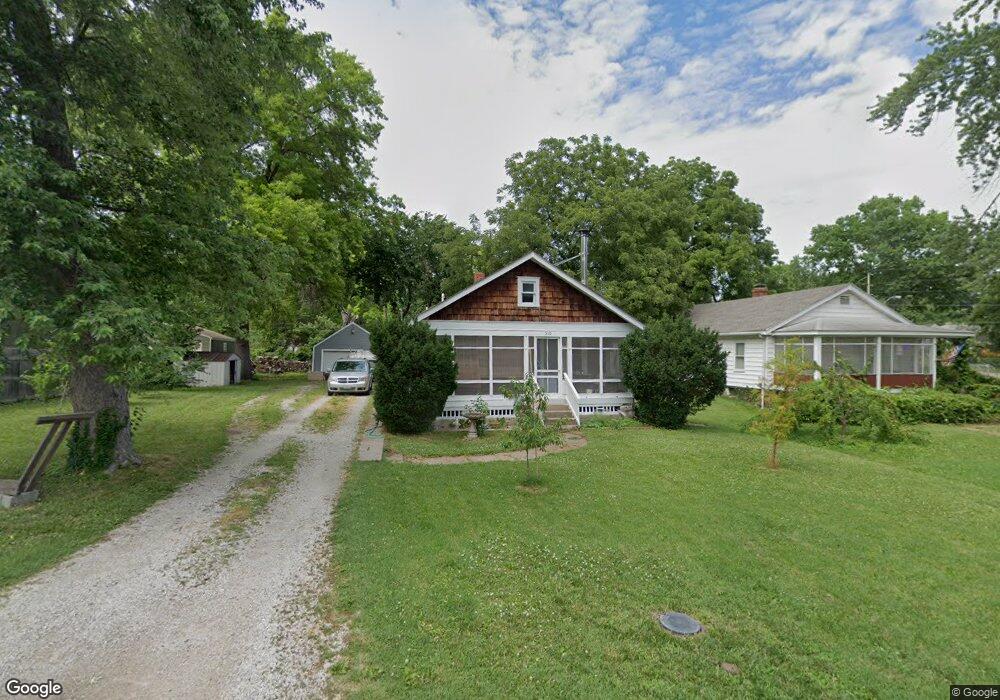
310 E 79th St Kansas City, MO 64114
Waldo NeighborhoodEstimated Value: $233,000 - $236,000
2
Beds
1
Bath
1,000
Sq Ft
$235/Sq Ft
Est. Value
About This Home
This home is located at 310 E 79th St, Kansas City, MO 64114 and is currently estimated at $234,744, approximately $234 per square foot. 310 E 79th St is a home located in Jackson County with nearby schools including John T. Hartman Elementary School, Central Middle School, and Southeast High School.
Ownership History
Date
Name
Owned For
Owner Type
Purchase Details
Closed on
Sep 17, 2010
Sold by
Sanders Jonathan M and Sanders Jonathan Micheal
Bought by
Sanders Jonathan M and Floyd Amanda R
Current Estimated Value
Home Financials for this Owner
Home Financials are based on the most recent Mortgage that was taken out on this home.
Original Mortgage
$53,000
Outstanding Balance
$35,069
Interest Rate
4.48%
Mortgage Type
New Conventional
Estimated Equity
$199,675
Purchase Details
Closed on
Feb 10, 2010
Sold by
U S Bank National Association
Bought by
Sanders Jonathan M and Sanders Jonathan Michael
Home Financials for this Owner
Home Financials are based on the most recent Mortgage that was taken out on this home.
Original Mortgage
$50,100
Interest Rate
4.95%
Mortgage Type
Future Advance Clause Open End Mortgage
Purchase Details
Closed on
Mar 10, 2008
Sold by
Satterfield James L
Bought by
U S Bank Na and Mastr Asset Backed Securities Trust 2006
Purchase Details
Closed on
Nov 16, 2004
Sold by
Satterfield James D and Satterfield Barbara C
Bought by
Satterfield James L
Create a Home Valuation Report for This Property
The Home Valuation Report is an in-depth analysis detailing your home's value as well as a comparison with similar homes in the area
Home Values in the Area
Average Home Value in this Area
Purchase History
| Date | Buyer | Sale Price | Title Company |
|---|---|---|---|
| Sanders Jonathan M | -- | Accommodation | |
| Sanders Jonathan M | -- | Mokan Title Services Llc | |
| U S Bank Na | $67,831 | Mo Kan Title Services Inc | |
| Satterfield James L | -- | -- |
Source: Public Records
Mortgage History
| Date | Status | Borrower | Loan Amount |
|---|---|---|---|
| Open | Sanders Jonathan M | $53,000 | |
| Closed | Sanders Jonathan M | $50,100 |
Source: Public Records
Tax History Compared to Growth
Tax History
| Year | Tax Paid | Tax Assessment Tax Assessment Total Assessment is a certain percentage of the fair market value that is determined by local assessors to be the total taxable value of land and additions on the property. | Land | Improvement |
|---|---|---|---|---|
| 2025 | $2,451 | $31,409 | $5,784 | $25,625 |
| 2024 | $2,428 | $31,059 | $5,736 | $25,323 |
| 2023 | $2,428 | $31,060 | $4,817 | $26,243 |
| 2022 | $1,954 | $23,750 | $2,866 | $20,884 |
| 2021 | $1,947 | $23,750 | $2,866 | $20,884 |
| 2020 | $1,732 | $20,859 | $2,866 | $17,993 |
| 2019 | $1,696 | $20,859 | $2,866 | $17,993 |
| 2018 | $1,445 | $18,154 | $2,494 | $15,660 |
| 2017 | $1,426 | $18,154 | $2,494 | $15,660 |
| 2016 | $1,426 | $17,816 | $2,847 | $14,969 |
| 2014 | $1,402 | $17,466 | $2,791 | $14,675 |
Source: Public Records
Map
Nearby Homes
- 119 E 78th Terrace
- 206 E 80th St
- 219 E 80th St
- 7744 Grand Ave
- 7712 McGee St
- 8005 Main St
- 7701 Walnut St
- 18 W 79th Terrace
- 601 E 77th St
- 11 E 80th Terrace
- 24 W 78th Terrace
- 102 E 81st St
- 7719 Kenwood Ave
- 7713 Kenwood Ave
- 7709 Kenwood Ave
- 7615 Oak St
- 7620 Grand Ave
- 7613 Locust St
- 109 W 80th St
- 601 E 81st Terrace
- 306 E 79th St
- 304 E 79th St
- 312 E 79th St
- 302 E 79th St
- 311 E 79th St
- 307 E 79th St
- 305 E 79th St
- 305 E 78th Terrace
- 307 E 78th Terrace
- 218 E 79th St
- 321 E 79th St
- 315 E 78th Terrace
- 200 E 79th St
- 219 E 79th St
- 301 E 78th Terrace
- 214 E 79th St
- 321 E 78th Terrace
- 217 E 79th St
- 223 E 78th Terrace
- 400 E 79th St