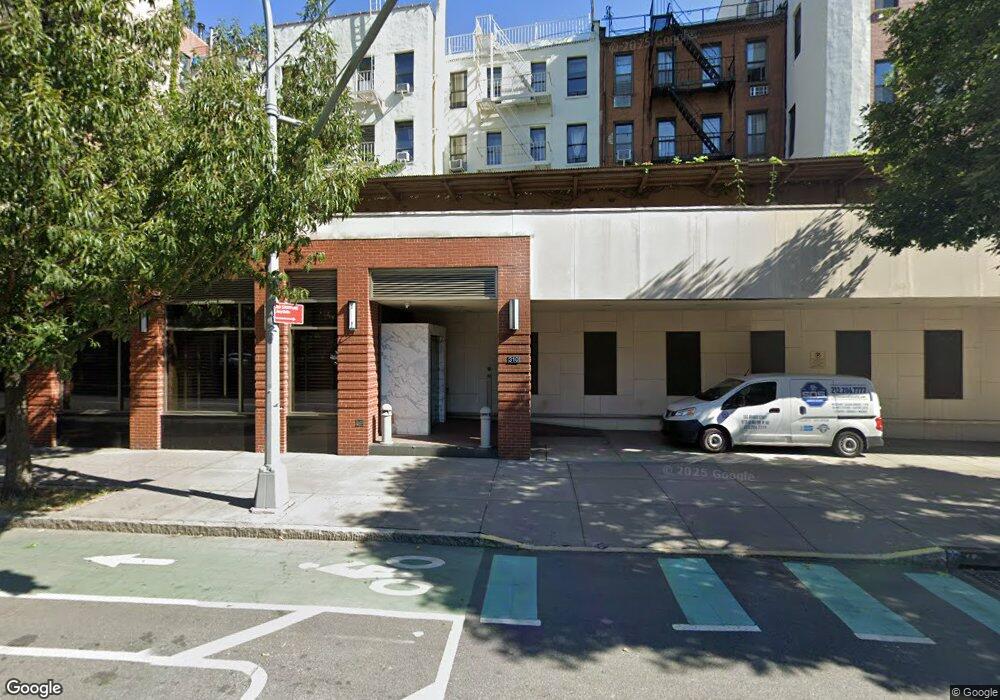
310 E Houston St Unit PHI New York, NY 10002
Lower East Side NeighborhoodEstimated Value: $3,132,000 - $6,832,000
--
Bed
--
Bath
2,671
Sq Ft
$1,984/Sq Ft
Est. Value
About This Home
This home is located at 310 E Houston St Unit PHI, New York, NY 10002 and is currently estimated at $5,299,069, approximately $1,983 per square foot. 310 E Houston St Unit PHI is a home located in New York County with nearby schools including The STAR Academy, Anna Silver Elementary, and P.S. 110 Florence Nightingale.
Ownership History
Date
Name
Owned For
Owner Type
Purchase Details
Closed on
Jun 30, 2015
Sold by
Marcello Porcelli and Trustee Of Nicole Sayfie Porcelli Family
Bought by
One Avenue B Penthouse Llc
Current Estimated Value
Home Financials for this Owner
Home Financials are based on the most recent Mortgage that was taken out on this home.
Original Mortgage
$3,600,000
Outstanding Balance
$2,808,048
Interest Rate
3.87%
Mortgage Type
Purchase Money Mortgage
Estimated Equity
$2,491,021
Purchase Details
Closed on
Dec 31, 2012
Sold by
Porcelli Nicole Sayfie
Bought by
Nicole Sayfie Porcelli Family Trust and Porcelli Trustee Marcello
Purchase Details
Closed on
Dec 29, 2008
Sold by
Paco East Houston Llc
Bought by
Porcelli Nicole Sayfie
Create a Home Valuation Report for This Property
The Home Valuation Report is an in-depth analysis detailing your home's value as well as a comparison with similar homes in the area
Home Values in the Area
Average Home Value in this Area
Purchase History
| Date | Buyer | Sale Price | Title Company |
|---|---|---|---|
| One Avenue B Penthouse Llc | $6,365,000 | -- | |
| Nicole Sayfie Porcelli Family Trust | -- | -- | |
| Porcelli Nicole Sayfie | $3,000,000 | -- |
Source: Public Records
Mortgage History
| Date | Status | Borrower | Loan Amount |
|---|---|---|---|
| Open | One Avenue B Penthouse Llc | $3,600,000 |
Source: Public Records
Tax History Compared to Growth
Tax History
| Year | Tax Paid | Tax Assessment Tax Assessment Total Assessment is a certain percentage of the fair market value that is determined by local assessors to be the total taxable value of land and additions on the property. | Land | Improvement |
|---|---|---|---|---|
| 2025 | $69,938 | $562,458 | $20,437 | $542,021 |
| 2024 | $69,938 | $559,411 | $20,437 | $538,974 |
| 2023 | $66,268 | $540,211 | $20,437 | $519,774 |
| 2022 | $68,629 | $592,076 | $20,437 | $571,639 |
| 2021 | $64,303 | $524,191 | $20,437 | $503,754 |
| 2020 | $63,231 | $580,348 | $20,437 | $559,911 |
| 2019 | $59,583 | $567,315 | $20,437 | $546,878 |
| 2018 | $44,950 | $547,522 | $20,437 | $527,085 |
| 2017 | $40,544 | $429,379 | $20,437 | $408,942 |
| 2016 | $29,778 | $436,531 | $20,438 | $416,093 |
| 2015 | $5,392 | $396,427 | $20,437 | $375,990 |
| 2014 | $5,392 | $373,239 | $20,438 | $352,801 |
Source: Public Records
Map
Nearby Homes
- 310 E Houston St Unit PH 1
- 310 E Houston St Unit 5A
- 287 E Houston St Unit 5C
- 287 E Houston St Unit 8A
- 154 Attorney St Unit 603
- 209 E 2nd St Unit 7
- 209 E 2nd St Unit 6
- 209 E 2nd St Unit 3
- 226 E 2nd St Unit 5E
- 185 E 2nd St Unit D
- 175 E 2nd St Unit 3/4A
- 186 E 2nd St Unit 8
- 50 Clinton St Unit PHA
- 50 Clinton St Unit 3C
- 50 Clinton St Unit PHC
- 184 E 2nd St Unit 4G
- 170 Norfolk St Unit 6
- 170 Norfolk St Unit 10
- 248 E 3rd St Unit 3B
- 66 Clinton St Unit PHA
- 310 E Houston St
- 310 E Houston St Unit PHF
- 310 E Houston St Unit PHE
- 310 E Houston St Unit PHC
- 310 E Houston St Unit PHB
- 310 E Houston St Unit PHA
- 310 E Houston St Unit 5E
- 310 E Houston St Unit 5D
- 310 E Houston St Unit 5C
- 310 E Houston St Unit 5B
- 310 E Houston St Unit 4F
- 310 E Houston St Unit 4E
- 310 E Houston St Unit 4D
- 310 E Houston St Unit 4C
- 310 E Houston St Unit 4B
- 310 E Houston St Unit 4A
- 310 E Houston St Unit 3F
- 310 E Houston St Unit 3E
- 310 E Houston St Unit 3D
- 310 E Houston St Unit 3C