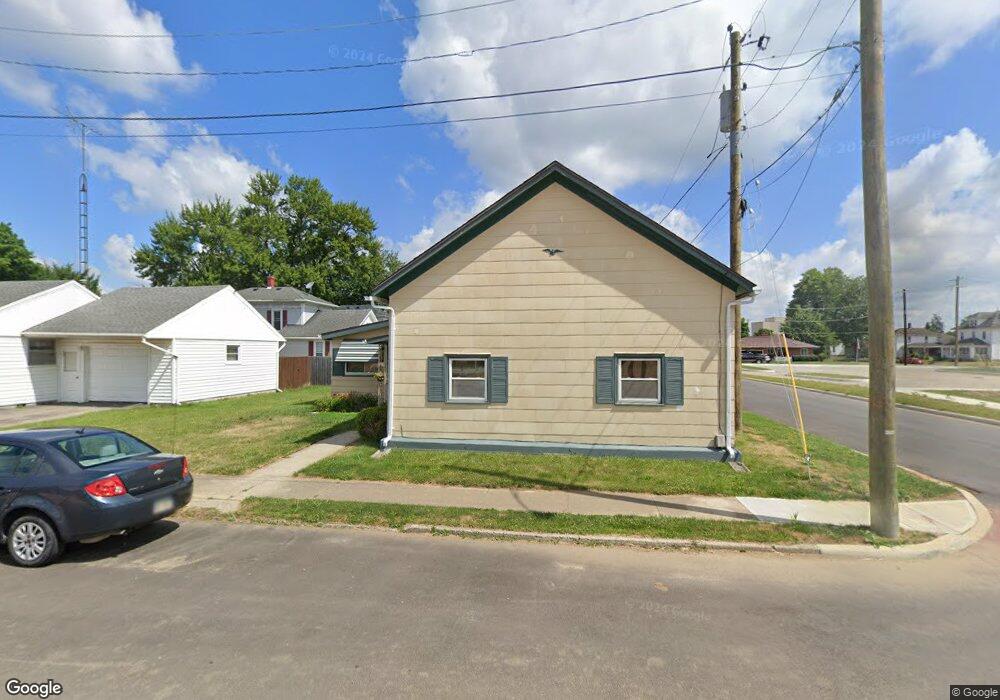
310 E Maple St Covington, OH 45318
Estimated Value: $131,221 - $162,000
2
Beds
1
Bath
1,376
Sq Ft
$108/Sq Ft
Est. Value
About This Home
This home is located at 310 E Maple St, Covington, OH 45318 and is currently estimated at $149,055, approximately $108 per square foot. 310 E Maple St is a home located in Miami County with nearby schools including Covington Elementary/Junior High School, Covington Junior High School, and Covington High School.
Ownership History
Date
Name
Owned For
Owner Type
Purchase Details
Closed on
Dec 23, 2010
Sold by
Brown Ronald L
Bought by
Weinert Sherri L and Brown Shawn E
Current Estimated Value
Purchase Details
Closed on
Jan 5, 2004
Sold by
Baldwin Susan L
Bought by
Brown Ronald L
Purchase Details
Closed on
Sep 18, 1995
Sold by
Helman Darrell
Bought by
Thomas Marvin D and Baldwin Susan L
Home Financials for this Owner
Home Financials are based on the most recent Mortgage that was taken out on this home.
Original Mortgage
$26,100
Interest Rate
7.75%
Mortgage Type
New Conventional
Create a Home Valuation Report for This Property
The Home Valuation Report is an in-depth analysis detailing your home's value as well as a comparison with similar homes in the area
Home Values in the Area
Average Home Value in this Area
Purchase History
| Date | Buyer | Sale Price | Title Company |
|---|---|---|---|
| Weinert Sherri L | -- | -- | |
| Brown Ronald L | $55,000 | -- | |
| Thomas Marvin D | $29,000 | -- |
Source: Public Records
Mortgage History
| Date | Status | Borrower | Loan Amount |
|---|---|---|---|
| Previous Owner | Thomas Marvin D | $26,100 |
Source: Public Records
Tax History
| Year | Tax Paid | Tax Assessment Tax Assessment Total Assessment is a certain percentage of the fair market value that is determined by local assessors to be the total taxable value of land and additions on the property. | Land | Improvement |
|---|---|---|---|---|
| 2025 | $1,173 | $35,110 | $6,480 | $28,630 |
| 2024 | $1,173 | $23,730 | $7,000 | $16,730 |
| 2023 | $909 | $23,730 | $7,000 | $16,730 |
| 2022 | $907 | $23,730 | $7,000 | $16,730 |
| 2021 | $753 | $18,270 | $5,390 | $12,880 |
| 2020 | $755 | $18,270 | $5,390 | $12,880 |
| 2019 | $758 | $18,270 | $5,390 | $12,880 |
| 2018 | $640 | $15,370 | $4,240 | $11,130 |
| 2017 | $651 | $15,370 | $4,240 | $11,130 |
| 2016 | $643 | $15,370 | $4,240 | $11,130 |
| 2015 | $593 | $14,770 | $4,060 | $10,710 |
| 2014 | $593 | $14,770 | $4,060 | $10,710 |
| 2013 | $572 | $14,770 | $4,060 | $10,710 |
Source: Public Records
Map
Nearby Homes
- 302 E Maple St
- 210 College St
- 216 College St
- 224 College St
- 222 E Maple St
- 207 College St
- 230 College St
- 235 College St
- 202 N Wall St
- 236 College St
- 212 N Wall St
- 116 N Grant St
- 201 N Grant St
- 245 College St
- 218 N Wall St
- 120 N Grant St
- 237 University St
- 239 University St
- 231 University St
- 246 College St
Your Personal Tour Guide
Ask me questions while you tour the home.