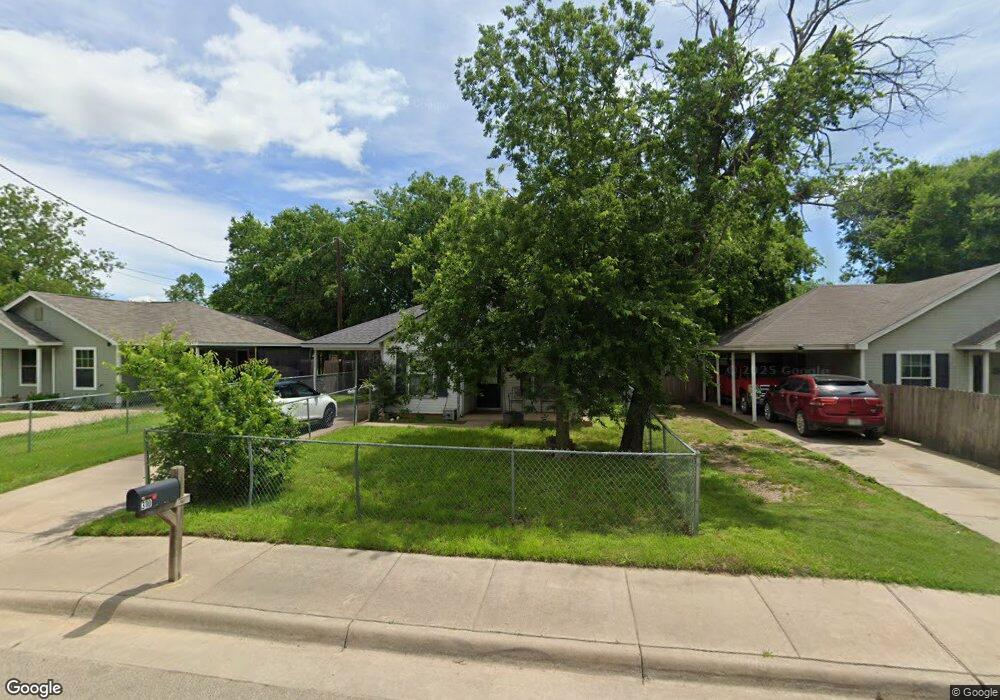
310 Elmo St Cleburne, TX 76031
Estimated Value: $149,000 - $223,000
3
Beds
2
Baths
1,048
Sq Ft
$174/Sq Ft
Est. Value
About This Home
This home is located at 310 Elmo St, Cleburne, TX 76031 and is currently estimated at $182,309, approximately $173 per square foot. 310 Elmo St is a home located in Johnson County with nearby schools including Irving Elementary School, A.D. Wheat Middle School, and Cleburne High School.
Ownership History
Date
Name
Owned For
Owner Type
Purchase Details
Closed on
Jun 2, 2009
Sold by
Federal Home Loan Mortgage Corporation
Bought by
Mathis Zack A and Colon Antoinette A
Current Estimated Value
Home Financials for this Owner
Home Financials are based on the most recent Mortgage that was taken out on this home.
Original Mortgage
$51,058
Outstanding Balance
$32,381
Interest Rate
4.84%
Mortgage Type
FHA
Estimated Equity
$149,928
Purchase Details
Closed on
Mar 3, 2009
Sold by
Rosen Deborah J and Rosen Edward A
Bought by
Federal Home Loan Mortgage Corp
Purchase Details
Closed on
Jun 1, 2006
Sold by
Dooley Charles L
Bought by
Rosen Deborah J
Home Financials for this Owner
Home Financials are based on the most recent Mortgage that was taken out on this home.
Original Mortgage
$71,250
Interest Rate
6.56%
Mortgage Type
New Conventional
Create a Home Valuation Report for This Property
The Home Valuation Report is an in-depth analysis detailing your home's value as well as a comparison with similar homes in the area
Home Values in the Area
Average Home Value in this Area
Purchase History
| Date | Buyer | Sale Price | Title Company |
|---|---|---|---|
| Mathis Zack A | -- | Fatco | |
| Federal Home Loan Mortgage Corp | $61,134 | None Available | |
| Rosen Deborah J | -- | None Available |
Source: Public Records
Mortgage History
| Date | Status | Borrower | Loan Amount |
|---|---|---|---|
| Open | Mathis Zack A | $51,058 | |
| Previous Owner | Rosen Deborah J | $71,250 |
Source: Public Records
Tax History
| Year | Tax Paid | Tax Assessment Tax Assessment Total Assessment is a certain percentage of the fair market value that is determined by local assessors to be the total taxable value of land and additions on the property. | Land | Improvement |
|---|---|---|---|---|
| 2025 | $2,716 | $121,793 | $43,000 | $78,793 |
| 2024 | $2,716 | $121,793 | $43,000 | $78,793 |
| 2023 | $2,403 | $108,004 | $23,500 | $84,504 |
| 2022 | $2,703 | $108,004 | $23,500 | $84,504 |
| 2021 | $3,294 | $126,240 | $23,500 | $102,740 |
| 2020 | $2,584 | $93,258 | $20,000 | $73,258 |
| 2019 | $2,756 | $93,258 | $20,000 | $73,258 |
| 2018 | $2,112 | $71,456 | $7,500 | $63,956 |
| 2017 | $2,103 | $71,456 | $7,500 | $63,956 |
| 2016 | $2,103 | $71,456 | $7,500 | $63,956 |
Source: Public Records
Map
Nearby Homes
Your Personal Tour Guide
Ask me questions while you tour the home.