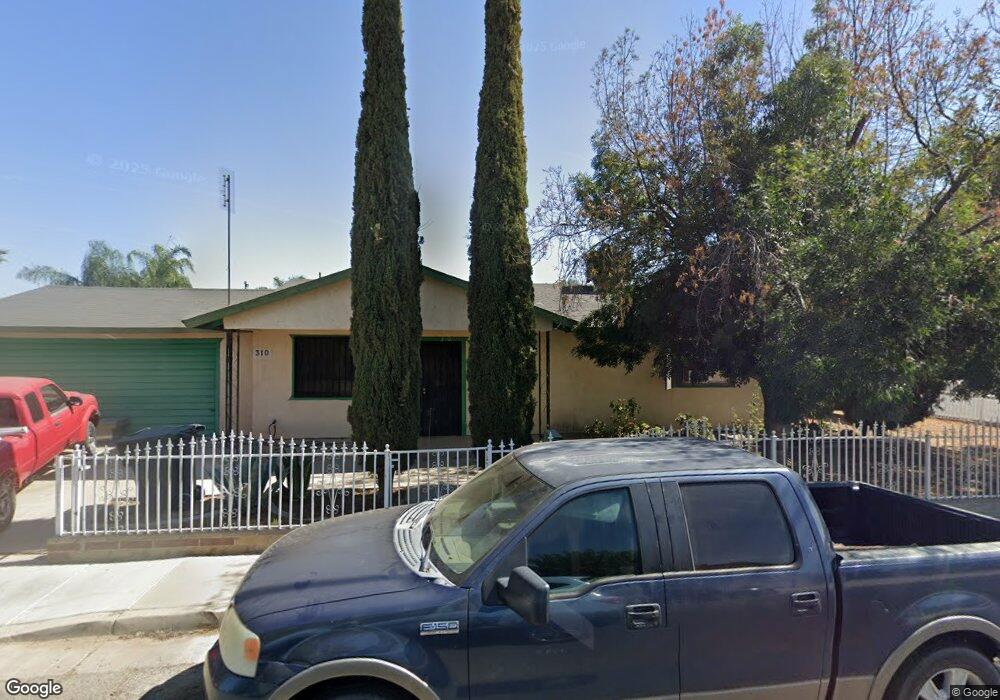
310 Fernwood St Mc Farland, CA 93250
Estimated Value: $280,000 - $323,000
3
Beds
2
Baths
1,040
Sq Ft
$289/Sq Ft
Est. Value
About This Home
This home is located at 310 Fernwood St, Mc Farland, CA 93250 and is currently estimated at $300,343, approximately $288 per square foot. 310 Fernwood St is a home located in Kern County with nearby schools including McFarland High School.
Ownership History
Date
Name
Owned For
Owner Type
Purchase Details
Closed on
Oct 29, 2011
Sold by
Rodriguez Magdaleno V and Tovar Juan R
Bought by
Rodriguez Magdaleno V and Rodriguez Magdalena M
Current Estimated Value
Purchase Details
Closed on
Jul 21, 1999
Sold by
Rodriguez Magdalena
Bought by
Rodriguez Magdaleno V
Home Financials for this Owner
Home Financials are based on the most recent Mortgage that was taken out on this home.
Original Mortgage
$69,939
Outstanding Balance
$19,513
Interest Rate
7.51%
Mortgage Type
FHA
Estimated Equity
$280,830
Purchase Details
Closed on
Jul 7, 1999
Sold by
Barrera Edilio B and Barrera Victorina V
Bought by
Rodriguez Magdaleno V and Tovar Juan R
Home Financials for this Owner
Home Financials are based on the most recent Mortgage that was taken out on this home.
Original Mortgage
$69,939
Outstanding Balance
$19,513
Interest Rate
7.51%
Mortgage Type
FHA
Estimated Equity
$280,830
Create a Home Valuation Report for This Property
The Home Valuation Report is an in-depth analysis detailing your home's value as well as a comparison with similar homes in the area
Home Values in the Area
Average Home Value in this Area
Purchase History
| Date | Buyer | Sale Price | Title Company |
|---|---|---|---|
| Rodriguez Magdaleno V | -- | None Available | |
| Rodriguez Magdaleno V | -- | First American Title Co | |
| Rodriguez Magdaleno V | $70,000 | First American Title Co |
Source: Public Records
Mortgage History
| Date | Status | Borrower | Loan Amount |
|---|---|---|---|
| Open | Rodriguez Magdaleno V | $69,939 | |
| Closed | Rodriguez Magdaleno V | $3,496 |
Source: Public Records
Tax History Compared to Growth
Tax History
| Year | Tax Paid | Tax Assessment Tax Assessment Total Assessment is a certain percentage of the fair market value that is determined by local assessors to be the total taxable value of land and additions on the property. | Land | Improvement |
|---|---|---|---|---|
| 2025 | $1,581 | $122,941 | $31,061 | $91,880 |
| 2024 | $1,554 | $120,531 | $30,452 | $90,079 |
| 2023 | $1,554 | $118,168 | $29,855 | $88,313 |
| 2022 | $1,516 | $115,852 | $29,270 | $86,582 |
| 2021 | $1,446 | $113,582 | $28,697 | $84,885 |
| 2020 | $1,397 | $112,418 | $28,403 | $84,015 |
| 2019 | $1,318 | $112,418 | $28,403 | $84,015 |
| 2018 | $1,302 | $108,054 | $27,301 | $80,753 |
| 2017 | $1,270 | $105,936 | $26,766 | $79,170 |
| 2016 | $1,253 | $103,860 | $26,242 | $77,618 |
| 2015 | $1,231 | $102,301 | $25,848 | $76,453 |
| 2014 | $1,179 | $100,298 | $25,342 | $74,956 |
Source: Public Records
Map
Nearby Homes
- 830 Davis Ave
- 249 Robertson Ave
- 389 Mount Arbor St
- 276 San Juan St
- 0 W Sherwood Ave Unit 202506495
- 0 W Sherwood Ave Unit 21453658
- 148 San Lucas St
- 254 E Sherwood Ave
- 0 E Sherwood Ave
- 733 Ensenata Dr
- 450 8th St
- 124 4th Place
- 314 8th St
- 539 11th St
- 737 Misty Ave
- 805 Price St
- 836 Fletcher St
- 852 Butte St
- 583 Taylor Ave
- 13271 Garzoli Ave
- 180 Glenwood Ave
- 320 Fernwood St
- 170 Glenwood Ave
- 330 Fernwood St
- 175 Glenwood Ave
- 315 Fernwood St
- 325 Fernwood St
- 305 Fernwood St
- 160 Glenwood Ave
- 135 Edgewood Ct
- 340 Fernwood St
- 335 Fernwood St
- 125 Edgewood Ct
- 165 Glenwood Ave
- 170 Fernwood St
- 235 Fernwood St
- 345 Fernwood St
- 130 Edgewood Ct
- 150 Glenwood Ave
- 350 Fernwood St