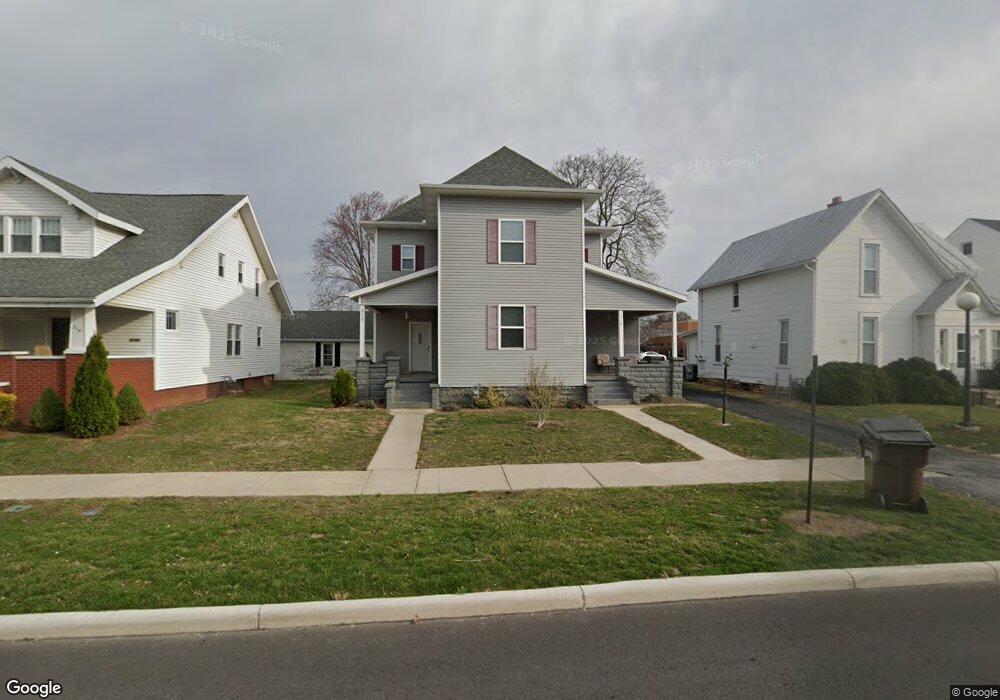
310 Frazer St Findlay, OH 45840
Estimated Value: $180,000 - $235,453
7
Beds
3
Baths
2,500
Sq Ft
$84/Sq Ft
Est. Value
About This Home
This home is located at 310 Frazer St, Findlay, OH 45840 and is currently estimated at $211,113, approximately $84 per square foot. 310 Frazer St is a home located in Hancock County with nearby schools including Whittier Primary School, Bigelow Hill Elementary School, and Glenwood Middle School.
Ownership History
Date
Name
Owned For
Owner Type
Purchase Details
Closed on
Jul 23, 2018
Sold by
Kromer Anita K
Bought by
Kbc Rentals Llc
Current Estimated Value
Purchase Details
Closed on
Sep 2, 2010
Sold by
Gupta Shiv K
Bought by
Kumar Anita S and Kromer Anita K
Create a Home Valuation Report for This Property
The Home Valuation Report is an in-depth analysis detailing your home's value as well as a comparison with similar homes in the area
Home Values in the Area
Average Home Value in this Area
Purchase History
| Date | Buyer | Sale Price | Title Company |
|---|---|---|---|
| Kbc Rentals Llc | $135,000 | Flag City Title Agency | |
| Kumar Anita S | -- | Attorney |
Source: Public Records
Tax History Compared to Growth
Tax History
| Year | Tax Paid | Tax Assessment Tax Assessment Total Assessment is a certain percentage of the fair market value that is determined by local assessors to be the total taxable value of land and additions on the property. | Land | Improvement |
|---|---|---|---|---|
| 2024 | $2,007 | $55,050 | $5,460 | $49,590 |
| 2023 | $1,984 | $55,050 | $5,460 | $49,590 |
| 2022 | $1,977 | $55,050 | $5,460 | $49,590 |
| 2021 | $1,761 | $42,700 | $5,450 | $37,250 |
| 2020 | $1,587 | $39,000 | $5,450 | $33,550 |
| 2019 | $1,555 | $39,000 | $5,450 | $33,550 |
| 2018 | $1,476 | $33,970 | $4,740 | $29,230 |
| 2017 | $758 | $33,970 | $4,740 | $29,230 |
| 2016 | $1,503 | $33,970 | $4,740 | $29,230 |
| 2015 | $1,514 | $33,660 | $4,740 | $28,920 |
| 2014 | $1,514 | $33,660 | $4,740 | $28,920 |
| 2012 | $1,525 | $33,660 | $4,740 | $28,920 |
Source: Public Records
Map
Nearby Homes
- 115 George St
- 706 N Cory St
- 524 Defiance Ave
- 533 Davis St
- 224 Defiance Ave
- 604 Davis St
- 206 Midland Ave
- 512 N Cory St
- 207 Ash Ave
- 230 Midland Ave
- 1005 Broad Ave
- 410 Monroe Ave
- 405 Clifton Ave
- 247 Crystal Ave
- 334 E Foulke Ave
- 213 Cherry St
- 1820 N Main St
- 304 Rector Ave
- 0 Canadian Way Unit 20253551
- 0 Canadian Way Unit 6135400