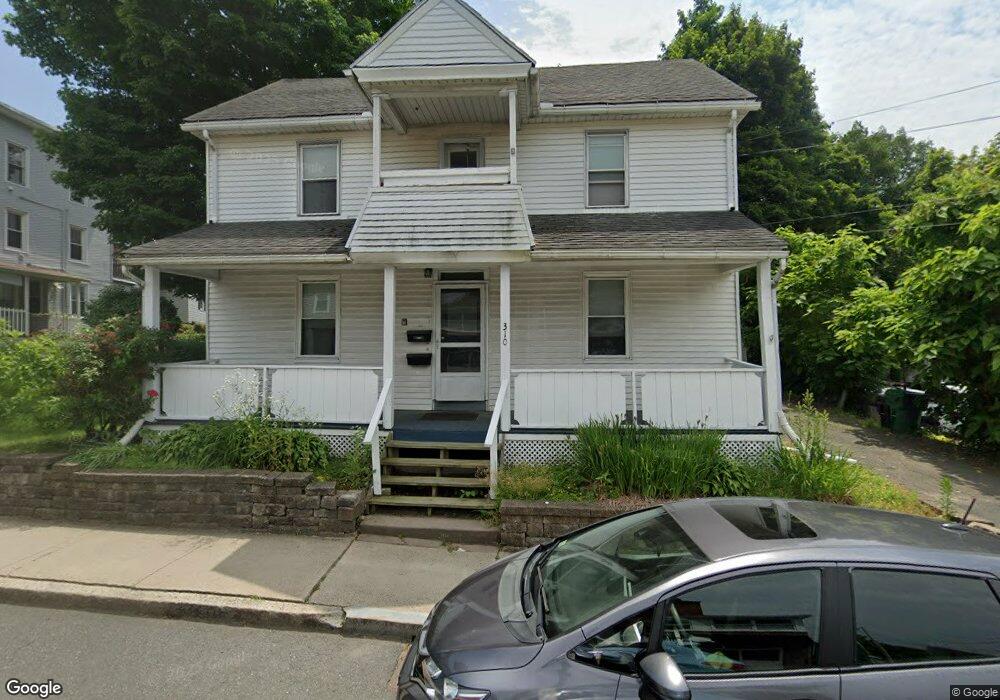
310 Front St Chicopee, MA 01013
Chicopee Center NeighborhoodEstimated Value: $322,000 - $324,000
31
Beds
20
Baths
17,488
Sq Ft
$18/Sq Ft
Est. Value
About This Home
This home is located at 310 Front St, Chicopee, MA 01013 and is currently estimated at $322,667, approximately $18 per square foot. 310 Front St is a home located in Hampden County with nearby schools including Bowe Elementary School, Fairview Middle School, and Chicopee High School.
Ownership History
Date
Name
Owned For
Owner Type
Purchase Details
Closed on
Feb 16, 2024
Sold by
Paf Irt and Frogameni
Bought by
Jonah Holdings Llc
Current Estimated Value
Home Financials for this Owner
Home Financials are based on the most recent Mortgage that was taken out on this home.
Original Mortgage
$660,000
Outstanding Balance
$648,358
Interest Rate
6.62%
Mortgage Type
Commercial
Estimated Equity
-$325,691
Purchase Details
Closed on
Jan 27, 2021
Sold by
Kv Properties Llc
Bought by
Paf Irt
Home Financials for this Owner
Home Financials are based on the most recent Mortgage that was taken out on this home.
Original Mortgage
$615,000
Interest Rate
2.67%
Mortgage Type
Commercial
Purchase Details
Closed on
Apr 3, 2008
Sold by
Vyce Sandra Lee and Klett Shirley M
Bought by
Kv Properties Llc
Create a Home Valuation Report for This Property
The Home Valuation Report is an in-depth analysis detailing your home's value as well as a comparison with similar homes in the area
Home Values in the Area
Average Home Value in this Area
Purchase History
| Date | Buyer | Sale Price | Title Company |
|---|---|---|---|
| Jonah Holdings Llc | $840,000 | None Available | |
| Paf Irt | $819,000 | None Available | |
| Kv Properties Llc | -- | -- |
Source: Public Records
Mortgage History
| Date | Status | Borrower | Loan Amount |
|---|---|---|---|
| Open | Jonah Holdings Llc | $660,000 | |
| Previous Owner | Paf Irt | $615,000 |
Source: Public Records
Tax History
| Year | Tax Paid | Tax Assessment Tax Assessment Total Assessment is a certain percentage of the fair market value that is determined by local assessors to be the total taxable value of land and additions on the property. | Land | Improvement |
|---|---|---|---|---|
| 2025 | $4,023 | $265,400 | $54,400 | $211,000 |
| 2024 | $3,805 | $257,800 | $53,400 | $204,400 |
| 2023 | $3,554 | $234,600 | $48,500 | $186,100 |
| 2022 | $3,483 | $205,000 | $42,200 | $162,800 |
| 2021 | $3,305 | $187,700 | $38,300 | $149,400 |
| 2020 | $3,103 | $177,700 | $38,300 | $139,400 |
| 2019 | $2,981 | $166,000 | $38,300 | $127,700 |
| 2018 | $2,917 | $159,300 | $36,500 | $122,800 |
| 2017 | $2,846 | $164,400 | $41,300 | $123,100 |
| 2016 | $2,680 | $158,500 | $41,300 | $117,200 |
| 2015 | $2,524 | $143,900 | $41,300 | $102,600 |
| 2014 | $2,376 | $143,900 | $41,300 | $102,600 |
Source: Public Records
Map
Nearby Homes
Your Personal Tour Guide
Ask me questions while you tour the home.