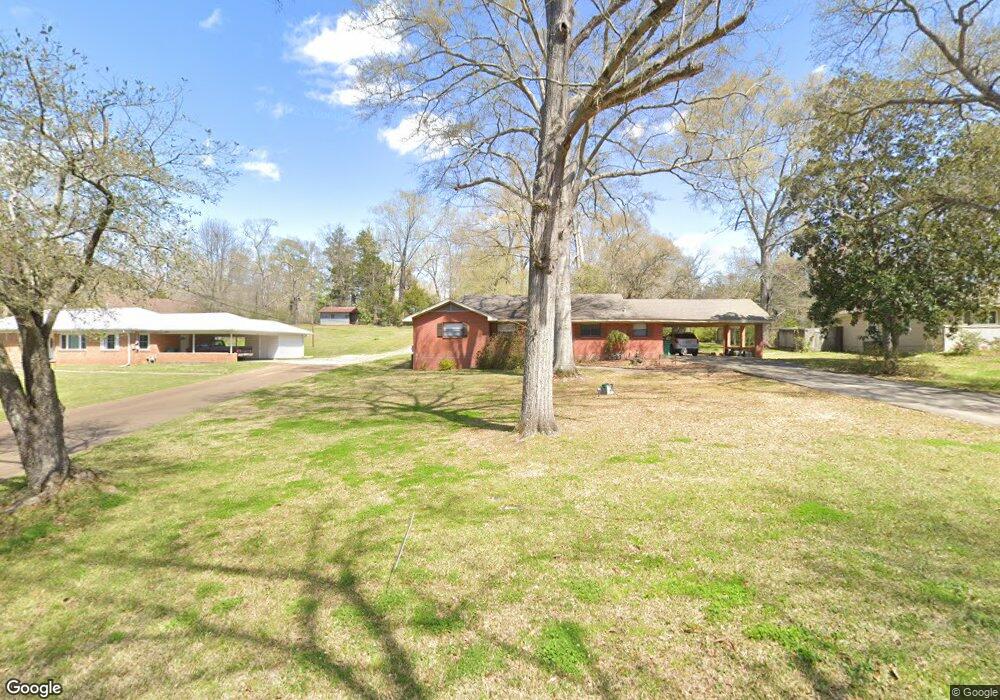
310 Gillespie Cir Unit B Raymond, MS 39154
Estimated Value: $144,620 - $283,000
2
Beds
1
Bath
1,544
Sq Ft
$140/Sq Ft
Est. Value
About This Home
This home is located at 310 Gillespie Cir Unit B, Raymond, MS 39154 and is currently estimated at $215,405, approximately $139 per square foot. 310 Gillespie Cir Unit B is a home located in Hinds County with nearby schools including Raymond Elementary School, Carver Middle School, and Raymond High School.
Ownership History
Date
Name
Owned For
Owner Type
Purchase Details
Closed on
Jun 7, 2021
Sold by
Burnham Debra
Bought by
Burnham Debra and Burnham Joseph Lee
Current Estimated Value
Purchase Details
Closed on
Mar 18, 2013
Sold by
John D John D
Bought by
Cole Jamie and Cole Robin
Purchase Details
Closed on
Dec 6, 2010
Sold by
Gray Brent O
Bought by
Fike John D
Create a Home Valuation Report for This Property
The Home Valuation Report is an in-depth analysis detailing your home's value as well as a comparison with similar homes in the area
Home Values in the Area
Average Home Value in this Area
Purchase History
| Date | Buyer | Sale Price | Title Company |
|---|---|---|---|
| Burnham Debra | -- | None Available | |
| Cole Jamie | -- | -- | |
| Fike John D | -- | -- |
Source: Public Records
Tax History Compared to Growth
Tax History
| Year | Tax Paid | Tax Assessment Tax Assessment Total Assessment is a certain percentage of the fair market value that is determined by local assessors to be the total taxable value of land and additions on the property. | Land | Improvement |
|---|---|---|---|---|
| 2025 | $1,337 | $9,027 | $1,800 | $7,227 |
| 2024 | $1,337 | $9,027 | $1,800 | $7,227 |
| 2023 | $1,337 | $9,027 | $1,800 | $7,227 |
| 2022 | $1,286 | $9,027 | $1,800 | $7,227 |
| 2021 | $611 | $6,018 | $1,200 | $4,818 |
| 2020 | $603 | $5,963 | $1,200 | $4,763 |
| 2019 | $599 | $5,963 | $1,200 | $4,763 |
| 2018 | $584 | $5,963 | $1,200 | $4,763 |
| 2017 | $552 | $5,963 | $1,200 | $4,763 |
| 2016 | $552 | $5,963 | $1,200 | $4,763 |
| 2015 | $537 | $5,841 | $1,200 | $4,641 |
| 2014 | $525 | $5,841 | $1,200 | $4,641 |
Source: Public Records
Map
Nearby Homes
- 00 Main St
- 104 Mcclendon Dr
- 190 Valley Dr
- 1052 Johnson Dr
- 1600 Pine Hill Dr
- 1425 Pine Hill Dr
- 0 Olde Oak Tree Ln
- 0 Wood Duck Cove Unit 4116304
- 00 Drake Landing
- 4 Mallard Crossing
- 4 Greenhead Ln
- 1899 Ratliff Rd
- 7511 Midway Rd
- 1875 Moses Rd
- 1644 Ratliff Rd
- 1600 Wright Rd
- 1700 Dunn Pease Rd
- 0 Mcfarland Rd Unit 21460112
- 7155 Jackson Raymond Rd Unit B
- 109 Herring Dr
- 310 Gillespie Cir
- 288 Gillespie Cir
- 218 Gilespie Cir
- 218 Gillespie Cir
- 244 Gillespie Cir
- 250 Gillespie Cir
- 318 Gillespie Cir
- 310 Gilespie Cir
- 310 Gilespie Cir
- 316 Gilespie Cir
- 304 Gilespie Cir
- 320 Gilespie Cir
- 273 Port Gibson St
- 241 Old Port Gibson St
- 249 Port Gibson St
- 305 Gilespie Cir
- 256 Port Gibson St
- 249 Gillespie Cir
- 107 Gillespie Cir
- 267 Gillespie Cir