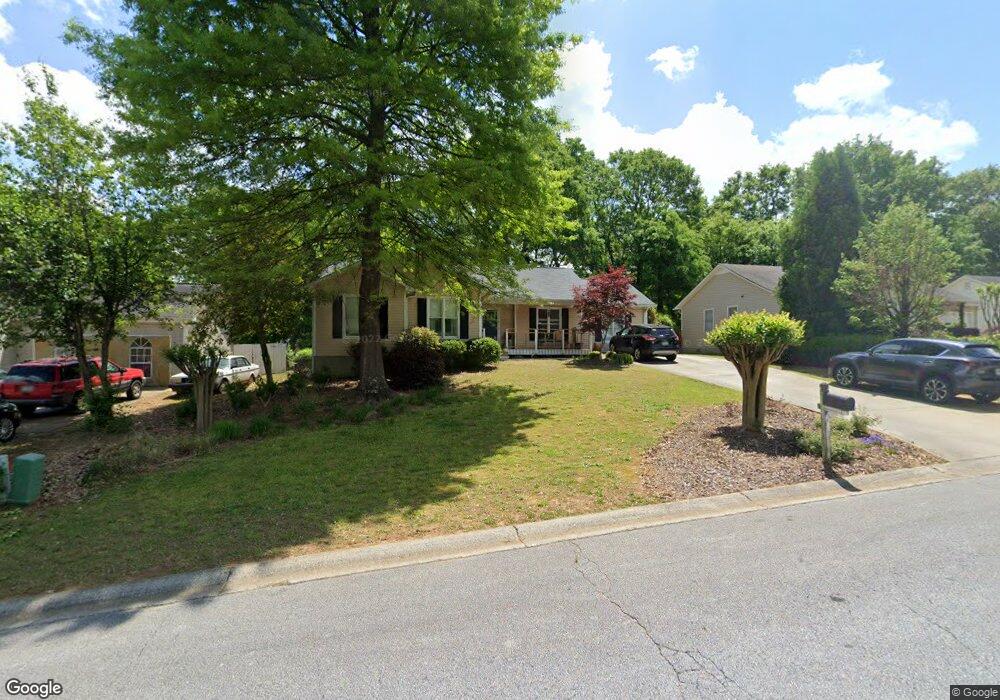
310 Mary Alice Dr Unit 1 Winder, GA 30680
Estimated Value: $259,000 - $283,000
--
Bed
2
Baths
1,256
Sq Ft
$215/Sq Ft
Est. Value
About This Home
This home is located at 310 Mary Alice Dr Unit 1, Winder, GA 30680 and is currently estimated at $270,327, approximately $215 per square foot. 310 Mary Alice Dr Unit 1 is a home located in Barrow County with nearby schools including Holsenbeck Elementary School, Bear Creek Middle School, and Winder-Barrow High School.
Ownership History
Date
Name
Owned For
Owner Type
Purchase Details
Closed on
Feb 25, 2002
Sold by
Reavis Tommy L and Reavis Stacey D
Bought by
Lance Kenneth A and Lance Teri E
Current Estimated Value
Home Financials for this Owner
Home Financials are based on the most recent Mortgage that was taken out on this home.
Original Mortgage
$101,906
Outstanding Balance
$41,819
Interest Rate
6.81%
Mortgage Type
FHA
Estimated Equity
$228,508
Purchase Details
Closed on
May 16, 1997
Sold by
Orr Johnny and Pierce Danny
Bought by
Reavis Tommy L and Reavis Stacey D
Home Financials for this Owner
Home Financials are based on the most recent Mortgage that was taken out on this home.
Original Mortgage
$84,048
Interest Rate
8.2%
Mortgage Type
VA
Create a Home Valuation Report for This Property
The Home Valuation Report is an in-depth analysis detailing your home's value as well as a comparison with similar homes in the area
Home Values in the Area
Average Home Value in this Area
Purchase History
| Date | Buyer | Sale Price | Title Company |
|---|---|---|---|
| Lance Kenneth A | $103,600 | -- | |
| Reavis Tommy L | $82,400 | -- |
Source: Public Records
Mortgage History
| Date | Status | Borrower | Loan Amount |
|---|---|---|---|
| Open | Lance Kenneth A | $101,906 | |
| Previous Owner | Reavis Tommy L | $84,048 |
Source: Public Records
Tax History Compared to Growth
Tax History
| Year | Tax Paid | Tax Assessment Tax Assessment Total Assessment is a certain percentage of the fair market value that is determined by local assessors to be the total taxable value of land and additions on the property. | Land | Improvement |
|---|---|---|---|---|
| 2024 | $1,900 | $79,152 | $20,000 | $59,152 |
| 2023 | $1,413 | $79,152 | $20,000 | $59,152 |
| 2022 | $1,823 | $61,031 | $16,400 | $44,631 |
| 2021 | $1,729 | $56,631 | $12,000 | $44,631 |
| 2020 | $1,576 | $52,350 | $12,000 | $40,350 |
| 2019 | $1,526 | $49,497 | $12,000 | $37,497 |
| 2018 | $1,363 | $43,108 | $10,000 | $33,108 |
| 2017 | $1,028 | $34,446 | $9,000 | $25,446 |
| 2016 | $903 | $30,445 | $8,000 | $22,445 |
| 2015 | $922 | $30,976 | $8,000 | $22,976 |
| 2014 | $860 | $29,865 | $5,488 | $24,377 |
| 2013 | -- | $28,704 | $5,488 | $23,216 |
Source: Public Records
Map
Nearby Homes
- 308 Mary Alice Dr Unit 57
- 308 Mary Alice Dr
- 308 Mary Alice Dr Unit 1
- 312 Mary Alice Dr Unit 1
- 0 Mary Alice Dr Unit 8710526
- 0 Mary Alice Dr Unit 8379410
- 0 Mary Alice Dr Unit 8217421
- 0 Mary Alice Dr Unit 8216216
- 0 Mary Alice Dr Unit 8602150
- 0 Mary Alice Dr Unit 8414598
- 0 Mary Alice Dr Unit 8953332
- 0 Mary Alice Dr Unit 9027268
- 0 Mary Alice Dr Unit 9067701
- 0 Mary Alice Dr Unit 9055833
- 0 Mary Alice Dr Unit 8772604
- 0 Mary Alice Dr Unit 8892088
- 0 Mary Alice Dr Unit 3150253
- 0 Mary Alice Dr Unit 7143323
- 0 Mary Alice Dr Unit 7149155
- 0 Mary Alice Dr Unit 7172100