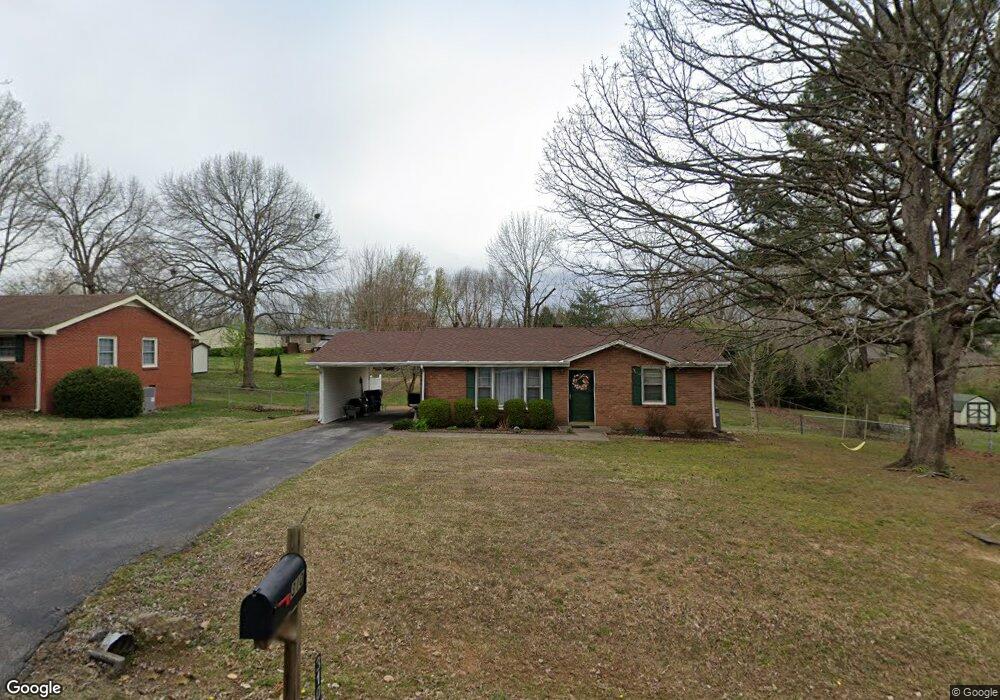
310 Mockingbird Ln Dickson, TN 37055
Estimated Value: $214,892 - $252,000
Studio
1
Bath
957
Sq Ft
$247/Sq Ft
Est. Value
About This Home
This home is located at 310 Mockingbird Ln, Dickson, TN 37055 and is currently estimated at $235,973, approximately $246 per square foot. 310 Mockingbird Ln is a home located in Dickson County with nearby schools including Oakmont Elementary School, Dickson Middle School, and Dickson County High School.
Ownership History
Date
Name
Owned For
Owner Type
Purchase Details
Closed on
Oct 10, 2013
Sold by
Copeland Dorothy A
Bought by
Fain Dorothy A
Current Estimated Value
Purchase Details
Closed on
Jun 6, 2005
Sold by
Brashears James T
Bought by
Copeland Dorothy A
Purchase Details
Closed on
May 22, 2002
Sold by
Guthrie Donald R
Bought by
Brashears James T
Home Financials for this Owner
Home Financials are based on the most recent Mortgage that was taken out on this home.
Original Mortgage
$75,318
Interest Rate
6.85%
Purchase Details
Closed on
Mar 3, 1998
Sold by
White Vicki V
Bought by
Guthrie Donald Ray
Home Financials for this Owner
Home Financials are based on the most recent Mortgage that was taken out on this home.
Original Mortgage
$62,474
Interest Rate
7.07%
Purchase Details
Closed on
Mar 31, 1987
Bought by
White Vicki V
Purchase Details
Closed on
Jun 16, 1982
Bought by
Davis Billy Joe
Create a Home Valuation Report for This Property
The Home Valuation Report is an in-depth analysis detailing your home's value as well as a comparison with similar homes in the area
Home Values in the Area
Average Home Value in this Area
Purchase History
| Date | Buyer | Sale Price | Title Company |
|---|---|---|---|
| Fain Dorothy A | -- | -- | |
| Copeland Dorothy A | $80,000 | -- | |
| Brashears James T | $76,500 | -- | |
| Guthrie Donald Ray | $63,000 | -- | |
| White Vicki V | $42,500 | -- | |
| Davis Billy Joe | -- | -- |
Source: Public Records
Mortgage History
| Date | Status | Borrower | Loan Amount |
|---|---|---|---|
| Previous Owner | Davis Billy Joe | $75,318 | |
| Previous Owner | Davis Billy Joe | $62,474 |
Source: Public Records
Tax History
| Year | Tax Paid | Tax Assessment Tax Assessment Total Assessment is a certain percentage of the fair market value that is determined by local assessors to be the total taxable value of land and additions on the property. | Land | Improvement |
|---|---|---|---|---|
| 2025 | -- | $48,650 | $13,750 | $34,900 |
| 2024 | -- | $48,650 | $13,750 | $34,900 |
| 2023 | $1,069 | $34,200 | $8,850 | $25,350 |
| 2022 | $1,069 | $34,200 | $8,850 | $25,350 |
| 2021 | $1,069 | $34,200 | $8,850 | $25,350 |
| 2020 | $1,069 | $34,200 | $8,850 | $25,350 |
| 2019 | $1,069 | $34,200 | $8,850 | $25,350 |
| 2018 | $861 | $23,575 | $6,250 | $17,325 |
| 2017 | $861 | $23,575 | $6,250 | $17,325 |
| 2016 | $861 | $23,575 | $6,250 | $17,325 |
| 2015 | $806 | $20,775 | $6,250 | $14,525 |
| 2014 | $806 | $20,775 | $6,250 | $14,525 |
Source: Public Records
Map
Nearby Homes
- 2061 S Hummingbird Ln
- 207 Robinson Dr
- 422 Shady Hill Rd
- 0 Canary Dr
- 108 W Quail Hollow Way
- 101 W Hills Terrace
- 815 Highway 70 E
- 103 Mack Dr
- 211 W Hills Terrace
- 114 Eastdale Ln
- 147 Eastdale Ln
- 102 W Lake Dr
- 101 Lake Circle Dr
- 110 Redbud Dr
- 101 Sunset Rd
- 103 Forrest Hills Dr
- 116 Skyline Dr
- 161 Caraway Ct
- 501 Caraway Ct
- 69 Truform Way
- 312 Mockingbird Ln
- 117 Louise Dr
- 309 Mockingbird Ln
- 311 Mockingbird Ln
- 121 Louise Dr
- 314 Mockingbird Ln
- 306 Mockingbird Ln
- 307 Mockingbird Ln
- 115 Louise Dr
- 313 Mockingbird Ln
- 123 Louise Dr
- 305 Mockingbird Ln
- 113 Louise Dr
- 103 Eleazer Dr
- 304 Mockingbird Ln
- 306 Bluebird Ln
- 315 Mockingbird Ln
- 125 Louise Dr
- 310 Bluebird Ln
- 304 Bluebird Ln
Your Personal Tour Guide
Ask me questions while you tour the home.