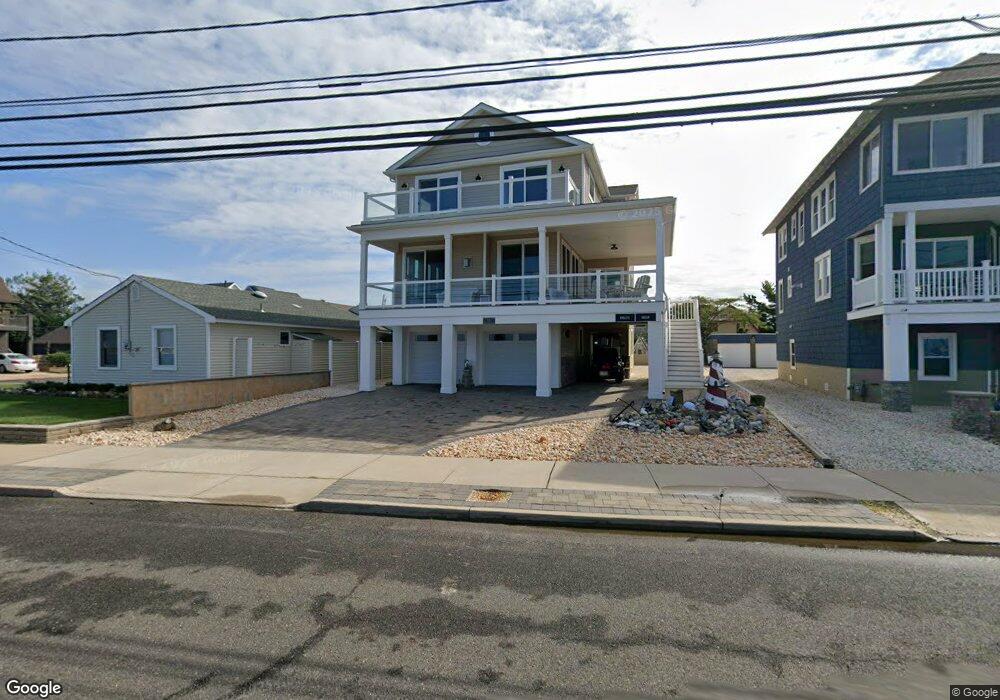
310 N Bayview Ave Seaside Park, NJ 08752
Estimated Value: $1,105,878 - $1,304,000
3
Beds
4
Baths
1,213
Sq Ft
$999/Sq Ft
Est. Value
About This Home
This home is located at 310 N Bayview Ave, Seaside Park, NJ 08752 and is currently estimated at $1,212,220, approximately $999 per square foot. 310 N Bayview Ave is a home located in Ocean County with nearby schools including Central Regional Middle School and Central Regional High School.
Ownership History
Date
Name
Owned For
Owner Type
Purchase Details
Closed on
Dec 4, 2019
Sold by
Sheehy Dorothy
Bought by
Walsh James K and Walsh Phyllis S
Current Estimated Value
Purchase Details
Closed on
Jul 29, 2008
Sold by
Sheehy Dorothy and Sheehy Victoria
Bought by
Sheehy Dorothy
Purchase Details
Closed on
May 30, 2007
Sold by
1118 Boulevard Trust
Bought by
Stango Ann
Create a Home Valuation Report for This Property
The Home Valuation Report is an in-depth analysis detailing your home's value as well as a comparison with similar homes in the area
Home Values in the Area
Average Home Value in this Area
Purchase History
| Date | Buyer | Sale Price | Title Company |
|---|---|---|---|
| Walsh James K | $570,000 | Surety Ttl Agcy Coastal Regi | |
| Sheehy Dorothy | -- | None Available | |
| Stango Ann | -- | None Available | |
| Calafat Luz | -- | None Available | |
| Gonzalez Ibet | -- | None Available |
Source: Public Records
Tax History Compared to Growth
Tax History
| Year | Tax Paid | Tax Assessment Tax Assessment Total Assessment is a certain percentage of the fair market value that is determined by local assessors to be the total taxable value of land and additions on the property. | Land | Improvement |
|---|---|---|---|---|
| 2025 | $10,657 | $651,400 | $429,600 | $221,800 |
| 2024 | $10,481 | $651,400 | $429,600 | $221,800 |
| 2023 | $10,110 | $651,400 | $429,600 | $221,800 |
| 2022 | $10,110 | $651,400 | $429,600 | $221,800 |
| 2021 | $6,526 | $429,600 | $429,600 | $0 |
| 2020 | $8,567 | $570,000 | $429,600 | $140,400 |
| 2019 | $7,732 | $520,000 | $450,000 | $70,000 |
| 2018 | $7,228 | $520,000 | $450,000 | $70,000 |
| 2017 | $7,337 | $520,000 | $450,000 | $70,000 |
| 2016 | $8,950 | $682,200 | $555,000 | $127,200 |
| 2015 | $8,469 | $618,600 | $555,000 | $63,600 |
| 2014 | $8,091 | $618,600 | $555,000 | $63,600 |
Source: Public Records
Map
Nearby Homes