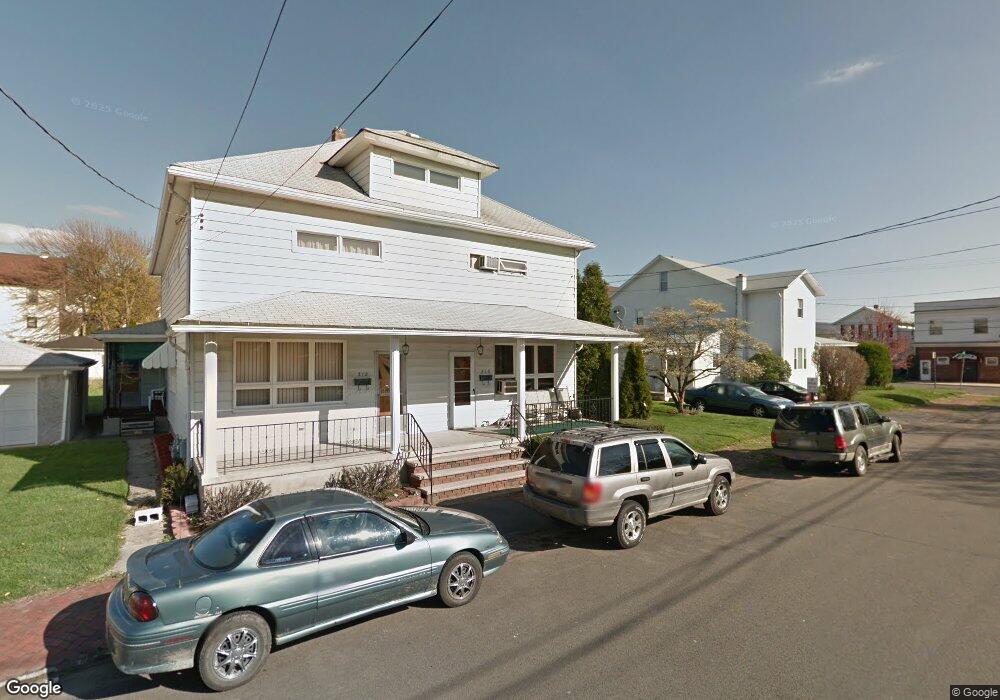
310 Salem St West Pittston, PA 18643
Estimated Value: $173,000 - $278,000
--
Bed
--
Bath
3,262
Sq Ft
$62/Sq Ft
Est. Value
About This Home
This home is located at 310 Salem St, West Pittston, PA 18643 and is currently estimated at $203,802, approximately $62 per square foot. 310 Salem St is a home located in Luzerne County with nearby schools including Wyoming Area Secondary Center, Wyoming Area Catholic School, and Holy Rosary Elementary School.
Ownership History
Date
Name
Owned For
Owner Type
Purchase Details
Closed on
Aug 24, 2023
Sold by
Carmadella John and Carmadella Cheryl
Bought by
Carmadella John and Carmadella Cheryl
Current Estimated Value
Purchase Details
Closed on
Nov 14, 2012
Sold by
Mascagni Lena
Bought by
Carmadella John and Hughes Cheryl
Create a Home Valuation Report for This Property
The Home Valuation Report is an in-depth analysis detailing your home's value as well as a comparison with similar homes in the area
Home Values in the Area
Average Home Value in this Area
Purchase History
| Date | Buyer | Sale Price | Title Company |
|---|---|---|---|
| Carmadella John | -- | None Listed On Document | |
| Carmadella John | $65,000 | None Available |
Source: Public Records
Tax History Compared to Growth
Tax History
| Year | Tax Paid | Tax Assessment Tax Assessment Total Assessment is a certain percentage of the fair market value that is determined by local assessors to be the total taxable value of land and additions on the property. | Land | Improvement |
|---|---|---|---|---|
| 2025 | $3,120 | $98,400 | $22,800 | $75,600 |
| 2024 | $2,993 | $98,400 | $22,800 | $75,600 |
| 2023 | $2,811 | $98,400 | $22,800 | $75,600 |
| 2022 | $2,793 | $98,400 | $22,800 | $75,600 |
| 2021 | $2,757 | $98,400 | $22,800 | $75,600 |
| 2020 | $2,672 | $98,400 | $22,800 | $75,600 |
| 2019 | $2,603 | $98,400 | $22,800 | $75,600 |
| 2018 | $2,497 | $98,400 | $22,800 | $75,600 |
| 2017 | $2,445 | $98,400 | $22,800 | $75,600 |
| 2016 | -- | $98,400 | $22,800 | $75,600 |
| 2015 | -- | $98,400 | $22,800 | $75,600 |
| 2014 | -- | $98,400 | $22,800 | $75,600 |
Source: Public Records
Map
Nearby Homes
- 707 Exeter Ave
- 827 Luzerne Ave
- 0 Exeter Ave
- 846 Exeter Ave
- 114 Washington St
- 870 Exeter Ave
- 23 Elm St
- 222 Luzerne Ave
- 215 Bennett St
- 355 Baltimore Ave
- 105 Spring St
- 333 Stanton St
- 31 Exeter Ave
- 37 Montgomery Ave
- 0 Wintermoot Island Unit 25-5891
- 101 Delaware Ave
- 535 Cherry Dr
- 1320 Susquehanna Ave
- 121 Penn Ave
- 18-20 Morgan Ln