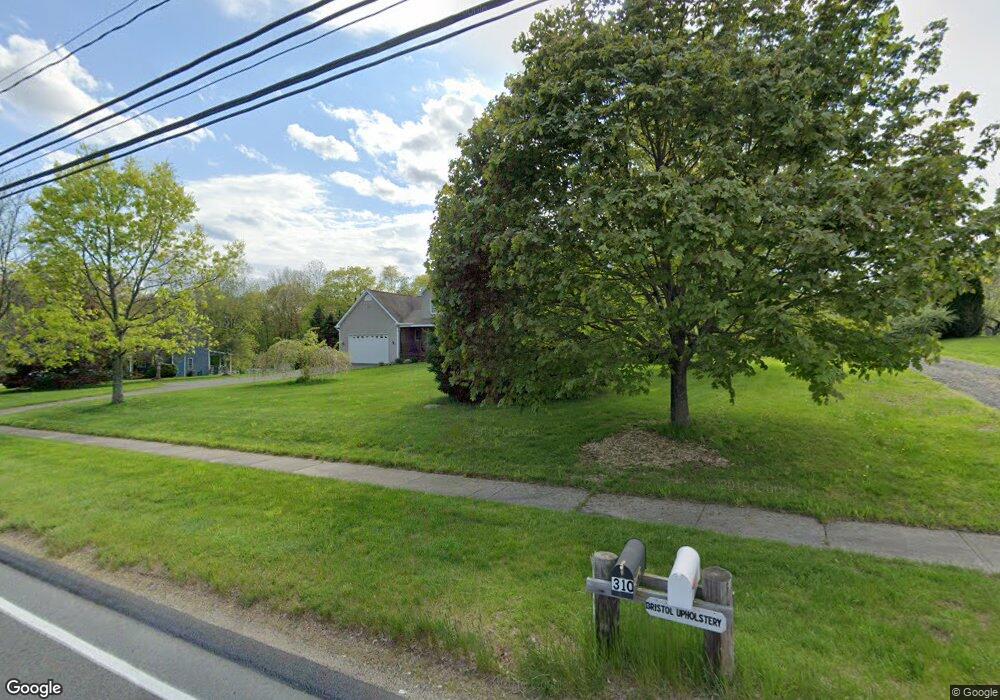
310 South St Plymouth, CT 06782
Estimated Value: $467,000 - $536,327
3
Beds
3
Baths
2,168
Sq Ft
$231/Sq Ft
Est. Value
About This Home
This home is located at 310 South St, Plymouth, CT 06782 and is currently estimated at $500,332, approximately $230 per square foot. 310 South St is a home located in Litchfield County with nearby schools including Plymouth Center School, Eli Terry Jr. Middle School, and Terryville High School.
Ownership History
Date
Name
Owned For
Owner Type
Purchase Details
Closed on
Mar 18, 2025
Sold by
Dorosh Leonard C and Dorosh Darlene M
Bought by
Dorosh Leonard C
Current Estimated Value
Home Financials for this Owner
Home Financials are based on the most recent Mortgage that was taken out on this home.
Original Mortgage
$412,167
Outstanding Balance
$410,057
Interest Rate
6.87%
Mortgage Type
VA
Estimated Equity
$90,275
Purchase Details
Closed on
Aug 30, 1999
Sold by
Vista 5 Group Llc
Bought by
Dorosh Leonard C and Dorosh Darlene M
Home Financials for this Owner
Home Financials are based on the most recent Mortgage that was taken out on this home.
Original Mortgage
$37,700
Interest Rate
7.53%
Create a Home Valuation Report for This Property
The Home Valuation Report is an in-depth analysis detailing your home's value as well as a comparison with similar homes in the area
Home Values in the Area
Average Home Value in this Area
Purchase History
| Date | Buyer | Sale Price | Title Company |
|---|---|---|---|
| Dorosh Leonard C | -- | None Available | |
| Dorosh Leonard C | -- | None Available | |
| Dorosh Leonard C | $41,900 | -- | |
| Dorosh Leonard C | $41,900 | -- |
Source: Public Records
Mortgage History
| Date | Status | Borrower | Loan Amount |
|---|---|---|---|
| Open | Dorosh Leonard C | $412,167 | |
| Closed | Dorosh Leonard C | $412,167 | |
| Previous Owner | Dorosh Leonard C | $287,672 | |
| Previous Owner | Dorosh Leonard C | $228,000 | |
| Previous Owner | Dorosh Leonard C | $37,700 |
Source: Public Records
Tax History Compared to Growth
Tax History
| Year | Tax Paid | Tax Assessment Tax Assessment Total Assessment is a certain percentage of the fair market value that is determined by local assessors to be the total taxable value of land and additions on the property. | Land | Improvement |
|---|---|---|---|---|
| 2025 | $9,016 | $227,850 | $71,190 | $156,660 |
| 2024 | $8,804 | $227,850 | $71,190 | $156,660 |
| 2023 | $8,590 | $227,850 | $71,190 | $156,660 |
| 2022 | $8,276 | $227,850 | $71,190 | $156,660 |
| 2021 | $8,303 | $204,365 | $80,010 | $124,355 |
| 2020 | $8,303 | $204,365 | $80,010 | $124,355 |
| 2019 | $8,303 | $204,365 | $80,010 | $124,355 |
| 2016 | $8,116 | $225,316 | $82,950 | $142,366 |
| 2015 | $7,983 | $225,316 | $82,950 | $142,366 |
| 2014 | $7,852 | $225,316 | $82,950 | $142,366 |
Source: Public Records
Map
Nearby Homes
- 17 Lake Plymouth Blvd
- 24 W Lakeview Rd
- 265 Lake Plymouth Blvd
- 60 Cedar Mountain Rd
- 211 Pine Hill Blvd Unit 211
- 214 Pine Hill Blvd Unit 214
- 56 Hillside Ave
- 123 Todd Hollow Rd
- 7 South St
- 684 Main St
- 785 Main St
- 461 E Main St
- 34 Warner Ln
- 43 Pine Hill Rd
- 143 Pine Hill Rd Unit 15F
- 96 Elm St
- 22 Park St
- 49 Center St
- 197 Pine Hill Rd Unit 2D
- 104 Judson St