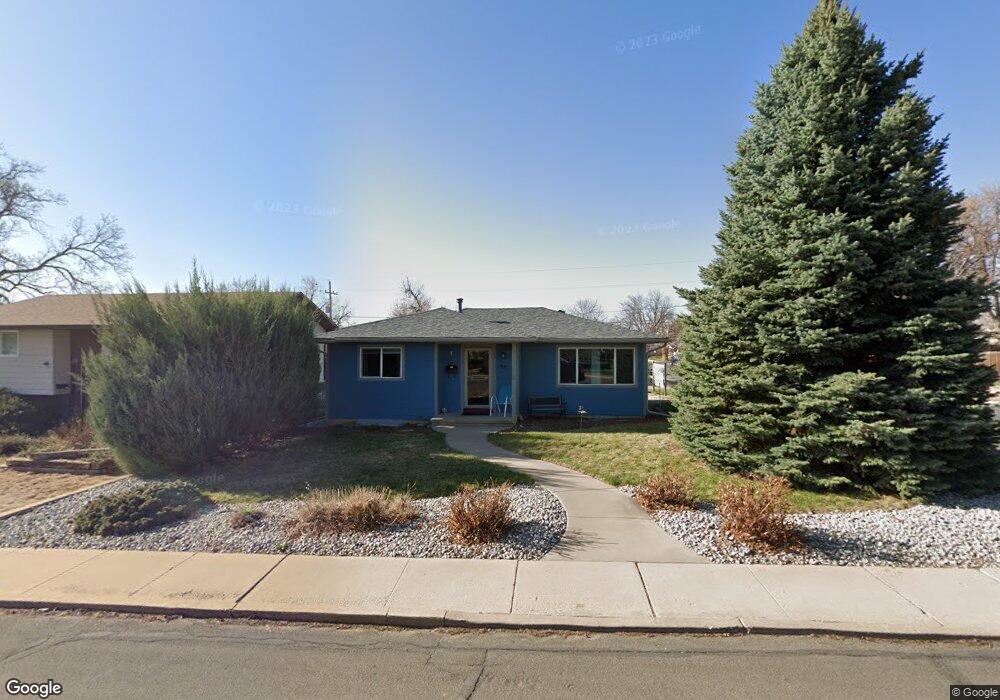
310 W Simpson St Lafayette, CO 80026
Estimated Value: $578,293 - $785,000
4
Beds
2
Baths
948
Sq Ft
$687/Sq Ft
Est. Value
About This Home
This home is located at 310 W Simpson St, Lafayette, CO 80026 and is currently estimated at $650,823, approximately $686 per square foot. 310 W Simpson St is a home located in Boulder County with nearby schools including Lafayette Elementary School, Angevine Middle School, and Centaurus High School.
Ownership History
Date
Name
Owned For
Owner Type
Purchase Details
Closed on
Apr 6, 2024
Sold by
Posusta Steven Michael
Bought by
Tringo Andrea
Current Estimated Value
Purchase Details
Closed on
Sep 6, 2000
Sold by
Villalobos Patricia Lucille
Bought by
Posusta Steven M
Home Financials for this Owner
Home Financials are based on the most recent Mortgage that was taken out on this home.
Original Mortgage
$158,400
Interest Rate
8.16%
Purchase Details
Closed on
Jun 8, 1995
Sold by
James Rose M
Bought by
James Rose M
Create a Home Valuation Report for This Property
The Home Valuation Report is an in-depth analysis detailing your home's value as well as a comparison with similar homes in the area
Home Values in the Area
Average Home Value in this Area
Purchase History
| Date | Buyer | Sale Price | Title Company |
|---|---|---|---|
| Tringo Andrea | -- | None Listed On Document | |
| Posusta Steven M | $198,000 | Land Title | |
| James Rose M | -- | -- |
Source: Public Records
Mortgage History
| Date | Status | Borrower | Loan Amount |
|---|---|---|---|
| Previous Owner | Posusta Steven M | $158,400 | |
| Closed | Posusta Steven M | $19,750 |
Source: Public Records
Tax History
| Year | Tax Paid | Tax Assessment Tax Assessment Total Assessment is a certain percentage of the fair market value that is determined by local assessors to be the total taxable value of land and additions on the property. | Land | Improvement |
|---|---|---|---|---|
| 2025 | $3,294 | $38,100 | $19,706 | $18,394 |
| 2024 | $3,294 | $38,100 | $19,706 | $18,394 |
| 2023 | $3,238 | $37,178 | $23,417 | $17,447 |
| 2022 | $2,880 | $30,657 | $16,451 | $14,206 |
| 2021 | $2,848 | $31,539 | $16,924 | $14,615 |
| 2020 | $2,629 | $28,765 | $15,802 | $12,963 |
| 2019 | $2,593 | $28,765 | $15,802 | $12,963 |
| 2018 | $2,327 | $25,488 | $7,920 | $17,568 |
| 2017 | $2,266 | $28,178 | $8,756 | $19,422 |
| 2016 | $2,294 | $24,987 | $7,642 | $17,345 |
| 2015 | $2,150 | $17,242 | $5,015 | $12,227 |
| 2014 | $1,557 | $17,242 | $5,015 | $12,227 |
Source: Public Records
Map
Nearby Homes
- 307 W Cleveland St
- 403 W Cannon St
- 107 N Public Rd
- 400 W Baseline Rd Unit B
- 402 W Baseline Rd Unit H
- 111 W Chester St
- 110 W Emma St Unit A
- 509 S Roosevelt Ave
- 421 S Dover Ave
- 409 E Cleveland St
- 209 Skylark Cir Unit 209
- 300 Skylark Cir
- 0 Rainbow Ln
- 1006 Sunburst Ct
- 712 Bunting Dr
- 709 Cardinal Dr
- 504 E Emma St
- 277 Skylark Cir
- 723 Cardinal Dr
- 921 Latigo Loop
- 308 W Simpson St
- 306 W Simpson St
- 400 W Simpson St
- 304 W Simpson St
- 311 W Cleveland St
- 309 W Cleveland St
- 401 W Cleveland St
- 302 W Simpson St
- 311 W Simpson St
- 311 W Simpson St Unit 8
- 404 W Simpson St
- 307 W Simpson St
- 305 W Cleveland St
- 403 W Cleveland St
- 305 W Simpson St
- 401 W Simpson St
- 303 W Cleveland St
- 406 W Simpson St
- 303 W Simpson St
- 407 W Cleveland St
Your Personal Tour Guide
Ask me questions while you tour the home.