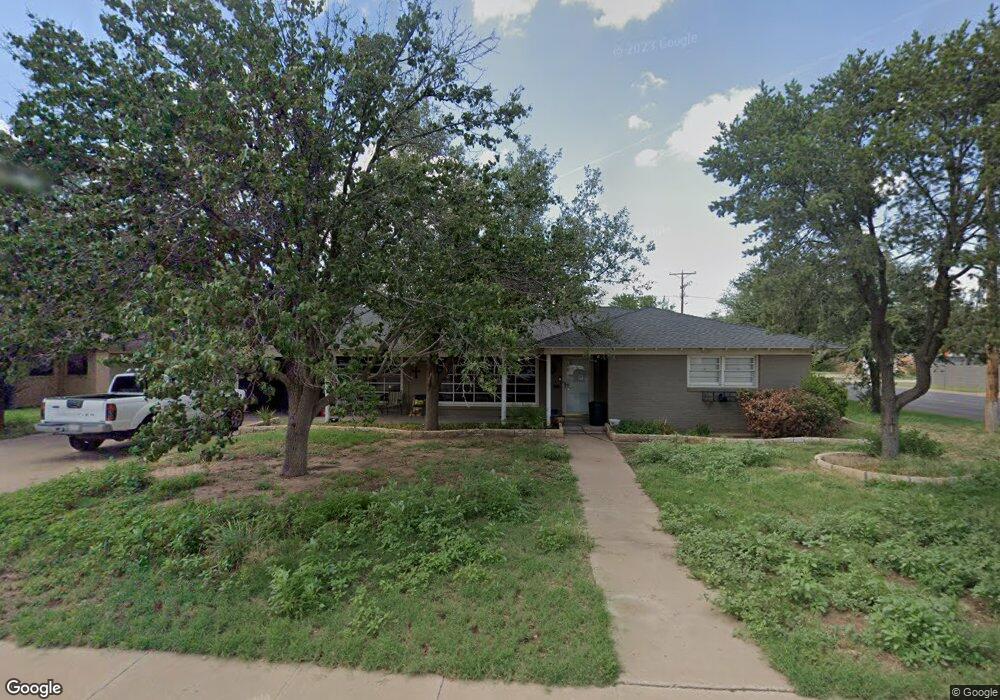
3100 Douglas Dr Midland, TX 79701
Estimated Value: $326,000 - $367,000
3
Beds
2
Baths
2,298
Sq Ft
$148/Sq Ft
Est. Value
About This Home
This home is located at 3100 Douglas Dr, Midland, TX 79701 and is currently estimated at $340,529, approximately $148 per square foot. 3100 Douglas Dr is a home located in Midland County with nearby schools including Fannin Elementary School, Midland High School, and Grace Lutheran Early Child Program.
Ownership History
Date
Name
Owned For
Owner Type
Purchase Details
Closed on
Sep 9, 2021
Sold by
Gray Stephani
Bought by
Hartley Pamela Leann and Hartley Nicholas James
Current Estimated Value
Home Financials for this Owner
Home Financials are based on the most recent Mortgage that was taken out on this home.
Original Mortgage
$202,400
Outstanding Balance
$183,767
Interest Rate
2.8%
Mortgage Type
Purchase Money Mortgage
Estimated Equity
$156,762
Purchase Details
Closed on
Feb 9, 2018
Sold by
Randy Blanscett Inc
Bought by
Gray Stephanie
Purchase Details
Closed on
Mar 12, 2003
Sold by
Hughes Lloyd G
Bought by
Blanscett Randy Inc
Purchase Details
Closed on
Aug 31, 1994
Bought by
Blanscett Randy Inc
Purchase Details
Closed on
Nov 14, 1961
Bought by
Blanscett Randy Inc
Create a Home Valuation Report for This Property
The Home Valuation Report is an in-depth analysis detailing your home's value as well as a comparison with similar homes in the area
Home Values in the Area
Average Home Value in this Area
Purchase History
| Date | Buyer | Sale Price | Title Company |
|---|---|---|---|
| Hartley Pamela Leann | -- | West Texas Abstract & Ttl Co | |
| Gray Stephanie | -- | Permian Abstract Co | |
| Blanscett Randy Inc | -- | -- | |
| Blanscett Randy Inc | -- | -- | |
| Blanscett Randy Inc | -- | -- |
Source: Public Records
Mortgage History
| Date | Status | Borrower | Loan Amount |
|---|---|---|---|
| Open | Hartley Pamela Leann | $202,400 |
Source: Public Records
Tax History Compared to Growth
Tax History
| Year | Tax Paid | Tax Assessment Tax Assessment Total Assessment is a certain percentage of the fair market value that is determined by local assessors to be the total taxable value of land and additions on the property. | Land | Improvement |
|---|---|---|---|---|
| 2025 | $2,897 | $294,350 | $26,720 | $267,630 |
| 2024 | $2,902 | $264,840 | $26,720 | $238,120 |
| 2023 | $2,683 | $253,000 | $26,720 | $226,280 |
| 2022 | $3,953 | $253,000 | $26,720 | $226,280 |
| 2021 | $4,051 | $301,750 | $26,720 | $275,030 |
| 2020 | $3,663 | $211,360 | $26,720 | $184,640 |
| 2019 | $4,001 | $211,360 | $26,720 | $184,640 |
| 2018 | $4,110 | $211,360 | $26,720 | $184,640 |
| 2017 | $4,110 | $211,360 | $26,720 | $184,640 |
| 2016 | $4,120 | $211,520 | $26,720 | $184,800 |
| 2015 | -- | $211,520 | $26,720 | $184,800 |
| 2014 | -- | $212,010 | $0 | $0 |
Source: Public Records
Map
Nearby Homes
- 3005 Douglas Dr
- 2902 Douglas Dr
- 2909 Princeton Ave
- 2905 W Golf Course Rd
- 3213 Sentinel Dr
- 1702 Cessna Dr
- 3204 W Golf Course Rd
- 5 Bristol Ct
- 3214 Lockheed Dr
- 1804 Culver Dr
- 3209 Sinclair Ave
- 2607 Bedford Ave
- 3213 Shell Ave
- 1903 Ward St
- 1906 Hughes St
- 3204 Shell Ave
- 3300 Storey Ave
- 3104 W Kansas Ave
- 2610 Storey Ave
- 2613 Storey Ave
- 3102 Douglas Dr
- 3101 Sentinel Dr
- 3006 Douglas Dr
- 3103 Sentinel Dr
- 3101 Douglas Dr
- 3104 Douglas Dr
- 3007 Sentinel Dr
- 3103 Douglas Dr
- 3004 Douglas Dr
- 3007 Douglas Dr
- 3105 Sentinel Dr
- 3005 Sentinel Dr
- 3106 Douglas Dr
- 3002 Douglas Dr
- 3105 Douglas Dr
- 3107 Sentinel Dr
- 3100 Princeton Ave
- 3100 Sentinel Dr
- 3003 Sentinel Dr
- 3102 Sentinel Dr