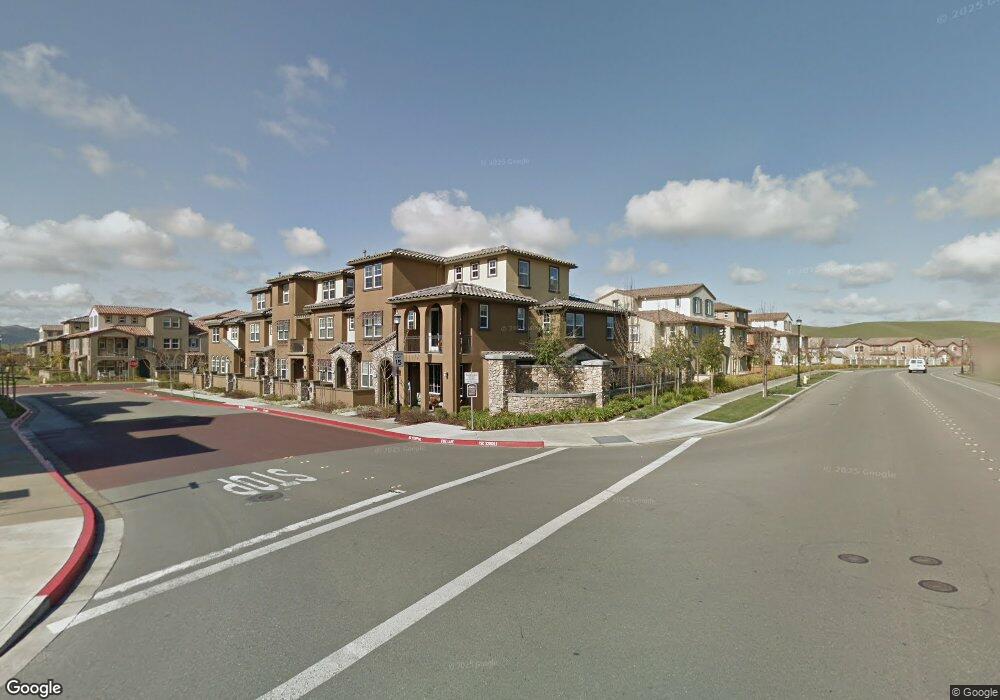
3100 Fioli Way Unit 149 San Ramon, CA 94582
Gale Ranch-Windemere NeighborhoodEstimated Value: $1,164,000 - $1,213,582
3
Beds
3
Baths
2,337
Sq Ft
$512/Sq Ft
Est. Value
About This Home
This home is located at 3100 Fioli Way Unit 149, San Ramon, CA 94582 and is currently estimated at $1,196,896, approximately $512 per square foot. 3100 Fioli Way Unit 149 is a home located in Contra Costa County with nearby schools including Hidden Hills Elementary School, Windemere Ranch Middle School, and Dougherty Valley High School.
Ownership History
Date
Name
Owned For
Owner Type
Purchase Details
Closed on
Jan 8, 2021
Sold by
Devalaraju Venkatam and Devalaraju Burga B
Bought by
Devalaraju Venkata M and Devalaraju Durga Bhavani
Current Estimated Value
Home Financials for this Owner
Home Financials are based on the most recent Mortgage that was taken out on this home.
Original Mortgage
$588,500
Outstanding Balance
$525,238
Interest Rate
2.71%
Mortgage Type
New Conventional
Estimated Equity
$671,658
Purchase Details
Closed on
Apr 23, 2014
Sold by
Devalaraju Venkata M
Bought by
Devalaraju Venkata M and Devalaraju Durga B
Purchase Details
Closed on
Oct 27, 2010
Sold by
Devalaraju Durga Bhavani
Bought by
Devalaraju Venkata M
Purchase Details
Closed on
Jul 26, 2010
Sold by
Centex Homes
Bought by
Devalaraju Venkata M
Home Financials for this Owner
Home Financials are based on the most recent Mortgage that was taken out on this home.
Original Mortgage
$621,628
Interest Rate
4.33%
Mortgage Type
FHA
Create a Home Valuation Report for This Property
The Home Valuation Report is an in-depth analysis detailing your home's value as well as a comparison with similar homes in the area
Home Values in the Area
Average Home Value in this Area
Purchase History
| Date | Buyer | Sale Price | Title Company |
|---|---|---|---|
| Devalaraju Venkata M | -- | Old Republic Title Company | |
| Devalaraju Venkata M | -- | None Available | |
| Devalaraju Venkata M | -- | First American Title Company | |
| Devalaraju Venkata M | $636,000 | First American Title Company |
Source: Public Records
Mortgage History
| Date | Status | Borrower | Loan Amount |
|---|---|---|---|
| Open | Devalaraju Venkata M | $588,500 | |
| Previous Owner | Devalaraju Venkata M | $621,628 |
Source: Public Records
Tax History Compared to Growth
Tax History
| Year | Tax Paid | Tax Assessment Tax Assessment Total Assessment is a certain percentage of the fair market value that is determined by local assessors to be the total taxable value of land and additions on the property. | Land | Improvement |
|---|---|---|---|---|
| 2025 | $12,890 | $814,819 | $204,984 | $609,835 |
| 2024 | $12,890 | $798,843 | $200,965 | $597,878 |
| 2023 | $12,710 | $783,180 | $197,025 | $586,155 |
| 2022 | $12,510 | $767,824 | $193,162 | $574,662 |
| 2021 | $12,221 | $752,770 | $189,375 | $563,395 |
| 2019 | $11,932 | $730,445 | $183,759 | $546,686 |
| 2018 | $11,566 | $716,123 | $180,156 | $535,967 |
| 2017 | $11,400 | $702,082 | $176,624 | $525,458 |
| 2016 | $11,305 | $688,316 | $173,161 | $515,155 |
| 2015 | $11,150 | $677,977 | $170,560 | $507,417 |
| 2014 | $11,043 | $664,697 | $167,219 | $497,478 |
Source: Public Records
Map
Nearby Homes
- 5132 Fioli Loop
- 5300 Fioli Loop
- 3221 Browntail Way
- 1412 Arianna Ln
- 406 Melrose Ct
- 224 Riverland Ct
- 1615 Lawrence Rd
- 2073 Watermill Rd
- 406 Glastonbury Ct
- 1610 Lawrence Rd
- 1038 S Monarch Rd
- 6260 Main Branch Rd
- 2165 Watermill Rd Unit 54
- 5010 Barrenstar Way
- 6132 Alpine Blue Dr
- 3454 Cinnamon Ridge Rd
- 3422 Cinnamon Ridge Rd
- 2308 Cedarwood Loop
- 41 Meadow Lake Dr
- 5110 Rowan Dr
- 3106 Fioli Way Unit 150
- 3112 Fioli Way Unit 151
- 3118 Fioli Way Unit 152
- 3126 Fioli Way
- 5036 Fioli Loop Unit 148
- 5032 Fioli Loop
- 5030 Fioli Loop
- 5000 Fioli Loop Unit 154
- 3107 Fioli Way Unit 124
- 5028 Fioli Loop Unit 145
- 3101 Fioli Way
- 3113 Fioli Way
- 5026 Fioli Loop Unit 144
- 3119 Fioli Way Unit 126
- 5022 Fioli Loop Unit 143
- 3127 Fioli Way Unit 127
- 5360 Fioli Loop Unit 128
- 5056 Fioli Loop
- 5058 Fioli Loop
- 5052 Fioli Loop Unit 141