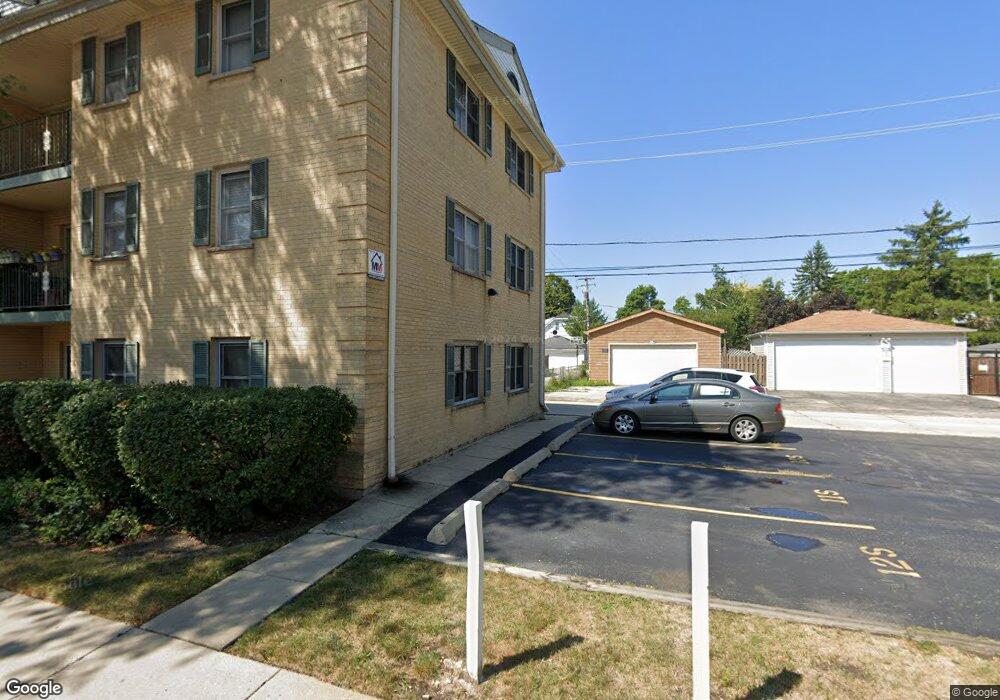
3100 N Nashville Ave Unit 301S Chicago, IL 60634
Montclare NeighborhoodEstimated Value: $212,000 - $236,000
--
Bed
--
Bath
--
Sq Ft
0.69
Acres
About This Home
This home is located at 3100 N Nashville Ave Unit 301S, Chicago, IL 60634 and is currently estimated at $220,324. 3100 N Nashville Ave Unit 301S is a home located in Cook County with nearby schools including Locke J Elementary School, Steinmetz College Prep, and Icci Academy.
Ownership History
Date
Name
Owned For
Owner Type
Purchase Details
Closed on
Aug 16, 2019
Sold by
Lopata Jerry and Lopata Malgorzata Noga
Bought by
Boyle Erin Kathleen
Current Estimated Value
Home Financials for this Owner
Home Financials are based on the most recent Mortgage that was taken out on this home.
Original Mortgage
$132,000
Outstanding Balance
$116,586
Interest Rate
4.12%
Mortgage Type
New Conventional
Estimated Equity
$103,738
Purchase Details
Closed on
Jun 28, 2001
Sold by
Ciejka Wieslaw B and Ciejka Jolanta Z
Bought by
Kulikowska Wanda
Home Financials for this Owner
Home Financials are based on the most recent Mortgage that was taken out on this home.
Original Mortgage
$137,700
Interest Rate
7.11%
Purchase Details
Closed on
Aug 20, 1998
Sold by
Stefanowski Todd A and Fedak Laura E
Bought by
Lopata Jaroslaw and Lopata Marian
Home Financials for this Owner
Home Financials are based on the most recent Mortgage that was taken out on this home.
Original Mortgage
$106,000
Interest Rate
6.9%
Create a Home Valuation Report for This Property
The Home Valuation Report is an in-depth analysis detailing your home's value as well as a comparison with similar homes in the area
Home Values in the Area
Average Home Value in this Area
Purchase History
| Date | Buyer | Sale Price | Title Company |
|---|---|---|---|
| Boyle Erin Kathleen | $147,000 | Altima Title Llc | |
| Kulikowska Wanda | $153,000 | Marquis Title | |
| Lopata Jaroslaw | $118,000 | Professional National Title |
Source: Public Records
Mortgage History
| Date | Status | Borrower | Loan Amount |
|---|---|---|---|
| Open | Boyle Erin Kathleen | $132,000 | |
| Previous Owner | Kulikowska Wanda | $137,700 | |
| Previous Owner | Lopata Jaroslaw | $106,000 |
Source: Public Records
Tax History Compared to Growth
Tax History
| Year | Tax Paid | Tax Assessment Tax Assessment Total Assessment is a certain percentage of the fair market value that is determined by local assessors to be the total taxable value of land and additions on the property. | Land | Improvement |
|---|---|---|---|---|
| 2024 | $2,043 | $19,479 | $3,793 | $15,686 |
| 2023 | $1,970 | $13,000 | $3,065 | $9,935 |
| 2022 | $1,970 | $13,000 | $3,065 | $9,935 |
| 2021 | $1,944 | $13,000 | $3,065 | $9,935 |
| 2020 | $1,269 | $8,797 | $1,529 | $7,268 |
| 2019 | $1,298 | $9,888 | $1,529 | $8,359 |
| 2018 | $1,275 | $9,888 | $1,529 | $8,359 |
| 2017 | $1,570 | $10,667 | $1,346 | $9,321 |
| 2016 | $1,636 | $10,667 | $1,346 | $9,321 |
| 2015 | $1,474 | $10,667 | $1,346 | $9,321 |
| 2014 | $1,724 | $11,858 | $1,284 | $10,574 |
| 2013 | $1,678 | $11,858 | $1,284 | $10,574 |
Source: Public Records
Map
Nearby Homes
- 6559 W George St Unit 506
- 6556 W Barry Ave Unit E
- 3111 N Nashville Ave Unit 1E
- 3020 N Nagle Ave
- 3034 N Nagle Ave
- 3120 N Natoma Ave
- 3121 N Normandy Ave
- 6565 W Belmont Ave Unit 104N
- 3011 N Oak Park Ave
- 6643 W Belmont Ave Unit 1
- 6653 W Belmont Ave
- 2834 N Narragansett Ave
- 3057 N Narragansett Ave Unit 7
- 2747 N Oak Park Ave
- 6616 W Melrose St
- 6736 W Belmont Ave
- 2848 N Mobile Ave
- 3250 N Natchez Ave
- 2830 N Mobile Ave
- 2930 N New England Ave
- 3100 N Nashville Ave Unit 103S
- 3100 N Nashville Ave Unit 202N
- 3100 N Nashville Ave Unit 301N
- 3100 N Nashville Ave Unit 101S
- 3100 N Nashville Ave Unit 303S
- 3100 N Nashville Ave Unit 102S
- 3100 N Nashville Ave Unit 302N
- 3100 N Nashville Ave Unit 101N
- 3100 N Nashville Ave Unit 104N
- 3100 N Nashville Ave Unit 204N
- 3100 N Nashville Ave Unit 103N
- 3100 N Nashville Ave Unit 104S
- 3100 N Nashville Ave Unit 201N
- 2954 N Nashville Ave
- 2944 N Nashville Ave
- 6601 W Wellington Ave
- 6605 W Wellington Ave
- 2953 N Nashville Ave
- 2949 N Nashville Ave
- 2955 N Nashville Ave