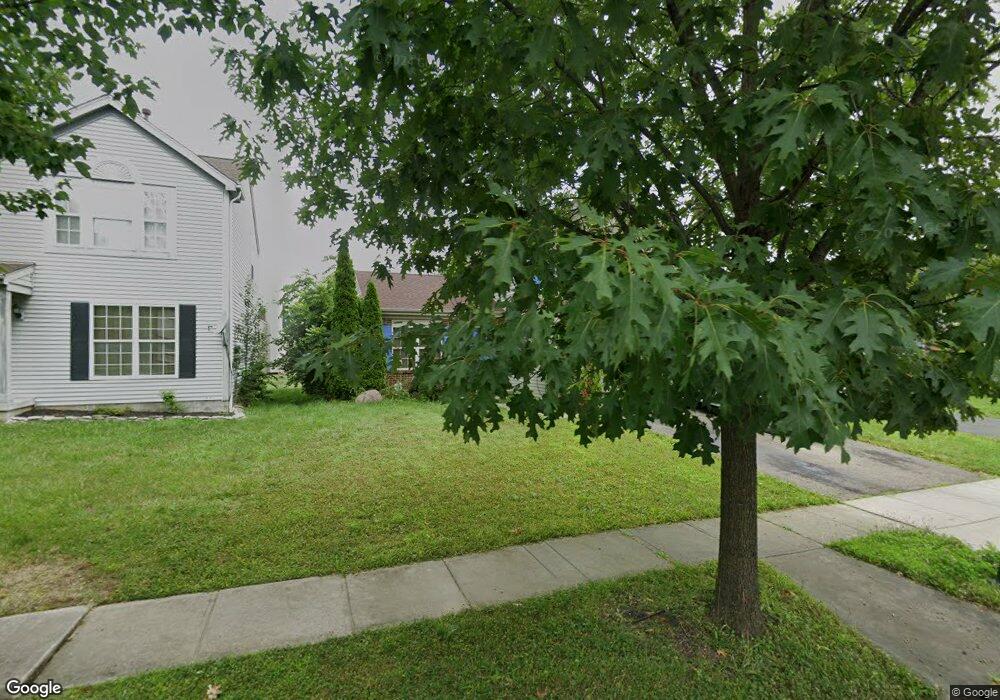
3100 Omega Dr Columbus, OH 43231
Brandywine NeighborhoodEstimated Value: $260,000 - $333,000
3
Beds
3
Baths
1,400
Sq Ft
$216/Sq Ft
Est. Value
About This Home
This home is located at 3100 Omega Dr, Columbus, OH 43231 and is currently estimated at $302,556, approximately $216 per square foot. 3100 Omega Dr is a home located in Franklin County with nearby schools including Avalon Elementary School, Northgate Intermediate, and Woodward Park Middle School.
Ownership History
Date
Name
Owned For
Owner Type
Purchase Details
Closed on
Oct 16, 2009
Sold by
Secretary Of Housing & Urban Development
Bought by
Godine Samson Y
Current Estimated Value
Home Financials for this Owner
Home Financials are based on the most recent Mortgage that was taken out on this home.
Original Mortgage
$98,188
Outstanding Balance
$64,181
Interest Rate
5.1%
Mortgage Type
FHA
Estimated Equity
$238,375
Purchase Details
Closed on
Mar 11, 2009
Sold by
Wells Fargo Bank Na
Bought by
Hud
Purchase Details
Closed on
Nov 6, 2008
Sold by
Knasinski Jason M and Case #06Cve10 13680
Bought by
Wells Fargo Bank Na
Purchase Details
Closed on
Sep 30, 1999
Sold by
M/I Schottenstein Homes Inc
Bought by
Knasinski Jason M and Knasinski Jennifer L
Home Financials for this Owner
Home Financials are based on the most recent Mortgage that was taken out on this home.
Original Mortgage
$141,941
Interest Rate
7.93%
Mortgage Type
FHA
Create a Home Valuation Report for This Property
The Home Valuation Report is an in-depth analysis detailing your home's value as well as a comparison with similar homes in the area
Home Values in the Area
Average Home Value in this Area
Purchase History
| Date | Buyer | Sale Price | Title Company |
|---|---|---|---|
| Godine Samson Y | $100,000 | Lakeside Title & Escrow Agen | |
| Hud | -- | Attorney | |
| Wells Fargo Bank Na | $100,000 | None Available | |
| Knasinski Jason M | $144,700 | Transohio Residential Title |
Source: Public Records
Mortgage History
| Date | Status | Borrower | Loan Amount |
|---|---|---|---|
| Open | Godine Samson Y | $98,188 | |
| Previous Owner | Knasinski Jason M | $141,941 |
Source: Public Records
Tax History Compared to Growth
Tax History
| Year | Tax Paid | Tax Assessment Tax Assessment Total Assessment is a certain percentage of the fair market value that is determined by local assessors to be the total taxable value of land and additions on the property. | Land | Improvement |
|---|---|---|---|---|
| 2024 | $3,835 | $85,440 | $17,570 | $67,870 |
| 2023 | $3,786 | $85,435 | $17,570 | $67,865 |
| 2022 | $2,750 | $53,030 | $8,650 | $44,380 |
| 2021 | $2,876 | $53,030 | $8,650 | $44,380 |
| 2020 | $2,759 | $53,030 | $8,650 | $44,380 |
| 2019 | $2,527 | $41,650 | $6,930 | $34,720 |
| 2018 | $2,318 | $41,650 | $6,930 | $34,720 |
| 2017 | $2,428 | $41,650 | $6,930 | $34,720 |
| 2016 | $2,330 | $35,180 | $6,580 | $28,600 |
| 2015 | $2,116 | $35,180 | $6,580 | $28,600 |
| 2014 | $2,121 | $35,180 | $6,580 | $28,600 |
| 2013 | $1,163 | $39,095 | $7,315 | $31,780 |
Source: Public Records
Map
Nearby Homes
- 3084 Omega Dr
- 2977 Ironstone Dr
- 2974 Footloose Dr
- 2901 Footloose Dr
- 2903 Kilbourne Ave
- 0 Alder Vista Dr
- 4858 Farview Rd
- 2734 Alder Vista Dr
- 4748 Black Sycamore Dr
- 4948 Black Sycamore Dr
- 4981 Black Sycamore Dr
- 2691 Northwold Rd
- 3010 Bennington Ave
- 3445 Steiner St
- 2500 Maplewood Dr
- 3098 Bennington Ave
- 3378 Trail Lane Ct
- 5394 Ponderosa Dr Unit 5394
- 3392 Trail Lane Ct
- 0 Abington Rd Unit 225045775
- 3108 Omega Dr
- 3092 Omega Dr
- 3073 Prosperity Ln Unit 269
- 3116 Omega Dr
- 3081 Prosperity Ln
- 3065 Prosperity Ln
- 3124 Omega Dr
- 3089 Prosperity Ln
- 3107 Omega Dr
- 3083 Omega Dr
- 4912 Kingpin Dr
- 4923 Fancyfree Ln
- 4918 Kingpin Dr
- 3097 Prosperity Ln
- 3132 Omega Dr
- 3123 Omega Dr
- 4924 Kingpin Dr
- 3075 Omega Dr
- 3105 Prosperity Ln
- 4931 Fancyfree Ln