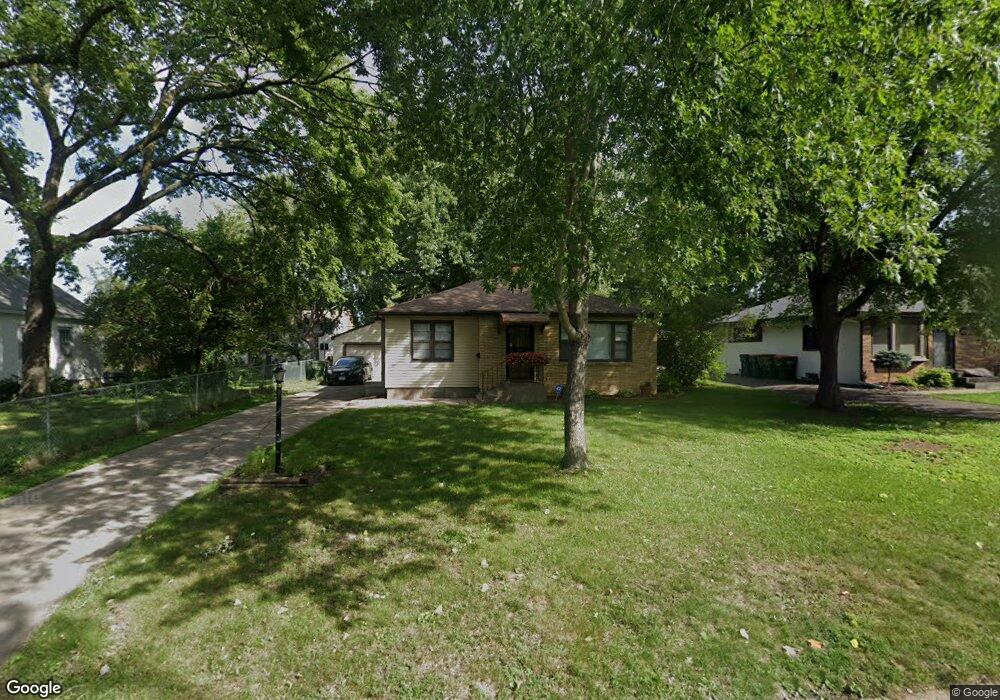
3101 32nd Ave NE Saint Anthony, MN 55418
Estimated Value: $345,000 - $401,000
3
Beds
2
Baths
1,820
Sq Ft
$209/Sq Ft
Est. Value
About This Home
This home is located at 3101 32nd Ave NE, Saint Anthony, MN 55418 and is currently estimated at $379,992, approximately $208 per square foot. 3101 32nd Ave NE is a home located in Hennepin County with nearby schools including Wilshire Park Elementary School, Highland Elementary School, and St. Anthony Middle School.
Ownership History
Date
Name
Owned For
Owner Type
Purchase Details
Closed on
May 6, 2021
Sold by
True Neighbor Investments Llc
Bought by
Marquardt Nicolette
Current Estimated Value
Home Financials for this Owner
Home Financials are based on the most recent Mortgage that was taken out on this home.
Original Mortgage
$284,750
Outstanding Balance
$257,651
Interest Rate
3%
Mortgage Type
New Conventional
Estimated Equity
$122,341
Purchase Details
Closed on
Feb 26, 2021
Sold by
Caldwell Michael A and Caldwell Judy L
Bought by
True Neighbor Investments Llc
Home Financials for this Owner
Home Financials are based on the most recent Mortgage that was taken out on this home.
Original Mortgage
$188,918
Interest Rate
2.7%
Mortgage Type
Commercial
Purchase Details
Closed on
Feb 13, 1996
Sold by
Garrish Lawrence
Bought by
Caldwell Michael A and Caldwell Judy L
Create a Home Valuation Report for This Property
The Home Valuation Report is an in-depth analysis detailing your home's value as well as a comparison with similar homes in the area
Home Values in the Area
Average Home Value in this Area
Purchase History
| Date | Buyer | Sale Price | Title Company |
|---|---|---|---|
| Marquardt Nicolette | $335,000 | Titlesmart Inc | |
| True Neighbor Investments Llc | $200,000 | Gibraltar Title Agency Llc | |
| Caldwell Michael A | $78,500 | -- | |
| -- | $200,000 | -- |
Source: Public Records
Mortgage History
| Date | Status | Borrower | Loan Amount |
|---|---|---|---|
| Open | Marquardt Nicolette | $284,750 | |
| Previous Owner | True Neighbor Investments Llc | $188,918 | |
| Closed | -- | $199,000 |
Source: Public Records
Tax History Compared to Growth
Tax History
| Year | Tax Paid | Tax Assessment Tax Assessment Total Assessment is a certain percentage of the fair market value that is determined by local assessors to be the total taxable value of land and additions on the property. | Land | Improvement |
|---|---|---|---|---|
| 2024 | $6,012 | $363,100 | $206,000 | $157,100 |
| 2023 | $5,679 | $351,300 | $194,000 | $157,300 |
| 2022 | $5,445 | $352,000 | $200,000 | $152,000 |
| 2021 | $4,789 | $333,000 | $204,000 | $129,000 |
| 2020 | $4,709 | $296,000 | $175,000 | $121,000 |
| 2019 | $4,104 | $278,000 | $160,000 | $118,000 |
| 2018 | $3,682 | $238,000 | $126,000 | $112,000 |
| 2017 | $3,932 | $207,000 | $101,000 | $106,000 |
| 2016 | $3,579 | $207,000 | $98,000 | $109,000 |
| 2015 | $3,503 | $182,000 | $91,000 | $91,000 |
| 2014 | -- | $182,000 | $101,000 | $81,000 |
Source: Public Records
Map
Nearby Homes
- 3212 33rd Ave NE
- 2916 31st Ave NE
- 2900 31st Ave NE
- 3013 Silver Lake Rd NE
- 2904 Old Highway 8
- 3212 29th Ave NE
- 3153 Old Highway 8 Unit B103A
- 3153 Old Highway 8 Unit 304A
- 2496 County Road C2 W Unit 303
- 3243 Mckinley St NE
- 3511 Maplewood Dr
- 2911 Troseth Rd
- 2517 36th Ave NE
- 3637 Coolidge St NE
- 2164 Eustis St
- 2516 27th Ave NE
- 2601 Kenzie Terrace Unit 402
- 2601 Kenzie Terrace Unit 324
- 2601 Kenzie Terrace Unit 519
- 2601 Kenzie Terrace Unit 512
- 3105 32nd Ave NE
- 3109 32nd Ave NE
- 3100 Hilldale Ave NE
- 3104 Hilldale Ave NE
- 3109 3109 32nd Ave NE
- 3013 32nd Ave NE
- 3016 Hilldale Ave NE
- 3113 32nd Ave NE
- 3108 Hilldale Ave NE
- 3100 32nd Ave NE
- 3104 32nd Ave NE
- 3117 32nd Ave NE
- 3012 Hilldale Ave NE
- 3016 32nd Ave NE
- 3108 32nd Ave NE
- 3016 3016 Hilldale Ave NE
- 3117 3117 32nd-Avenue-ne
- 3012 32nd Ave NE
- 3201 32nd Ave NE
- 3110 32nd Ave NE