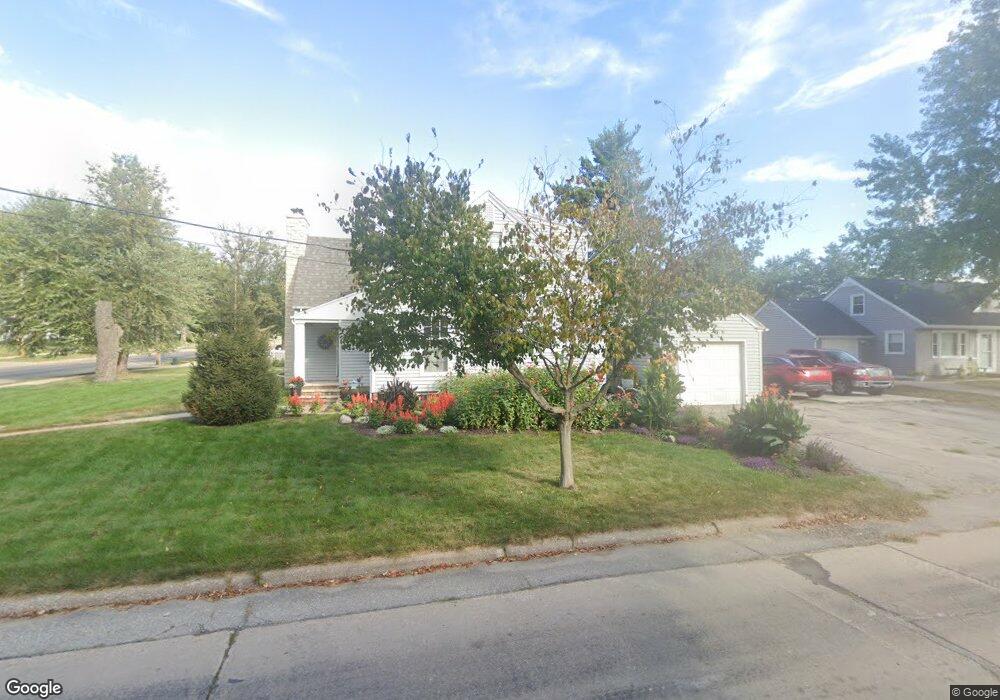
3101 Bever Ave SE Cedar Rapids, IA 52403
Bever Park NeighborhoodEstimated Value: $163,000 - $208,000
2
Beds
2
Baths
1,510
Sq Ft
$121/Sq Ft
Est. Value
About This Home
This home is located at 3101 Bever Ave SE, Cedar Rapids, IA 52403 and is currently estimated at $182,095, approximately $120 per square foot. 3101 Bever Ave SE is a home located in Linn County with nearby schools including Erskine Elementary School, McKinley STEAM Academy, and George Washington High School.
Ownership History
Date
Name
Owned For
Owner Type
Purchase Details
Closed on
Mar 24, 2022
Sold by
Ellen Griffith Margaret and Ellen Steven L
Bought by
Weuste Kathleen M
Current Estimated Value
Home Financials for this Owner
Home Financials are based on the most recent Mortgage that was taken out on this home.
Original Mortgage
$30,000
Outstanding Balance
$19,275
Interest Rate
3.83%
Estimated Equity
$162,820
Purchase Details
Closed on
Mar 1, 2021
Sold by
Griffith Margaret Ellen and Griffith Steven L
Bought by
Griffith Margaret Ellen and Griffith Steven L
Purchase Details
Closed on
Jan 7, 2021
Sold by
Gibson Barry L
Bought by
Griffith Margaret Ellen and Gibson Margaret E
Create a Home Valuation Report for This Property
The Home Valuation Report is an in-depth analysis detailing your home's value as well as a comparison with similar homes in the area
Home Values in the Area
Average Home Value in this Area
Purchase History
| Date | Buyer | Sale Price | Title Company |
|---|---|---|---|
| Weuste Kathleen M | $150,000 | Shuttleworth & Ingersoll Plc | |
| Griffith Margaret Ellen | -- | None Available | |
| Griffith Margaret Ellen | -- | None Available |
Source: Public Records
Mortgage History
| Date | Status | Borrower | Loan Amount |
|---|---|---|---|
| Open | Weuste Kathleen M | $30,000 | |
| Open | Weuste Kathleen M | $120,000 |
Source: Public Records
Tax History Compared to Growth
Tax History
| Year | Tax Paid | Tax Assessment Tax Assessment Total Assessment is a certain percentage of the fair market value that is determined by local assessors to be the total taxable value of land and additions on the property. | Land | Improvement |
|---|---|---|---|---|
| 2025 | $2,470 | $188,800 | $35,400 | $153,400 |
| 2024 | $3,346 | $169,300 | $32,400 | $136,900 |
| 2023 | $3,346 | $170,800 | $32,400 | $138,400 |
| 2022 | $3,110 | $167,500 | $35,400 | $132,100 |
| 2021 | $3,110 | $159,100 | $35,400 | $123,700 |
| 2020 | $3,292 | $157,800 | $35,400 | $122,400 |
| 2019 | $3,104 | $152,500 | $35,400 | $117,100 |
| 2018 | $3,014 | $152,500 | $35,400 | $117,100 |
| 2017 | $3,120 | $151,800 | $35,400 | $116,400 |
| 2016 | $3,226 | $151,800 | $35,400 | $116,400 |
| 2015 | $3,144 | $147,741 | $35,363 | $112,378 |
| 2014 | $3,144 | $145,375 | $35,363 | $110,012 |
| 2013 | $3,028 | $145,375 | $35,363 | $110,012 |
Source: Public Records
Map
Nearby Homes
- 431 30th St SE
- 415 35th St SE
- 3200 Mound Ave SE
- 639 32nd St SE
- 3223 Mound Ave SE
- 651 34th St SE
- 654 34th St SE
- 380 Indiandale Rd SE
- 18 Blake Terrace SE
- 2700 Mount Vernon Rd SE
- 3830 Skylark Ln SE
- 237 34th St SE
- 700 Memorial Dr SE
- 637 Grant Wood Dr SE
- 2227 Kestrel Dr SE
- 2403 Kestrel Dr SE
- 2416 Kestrel Dr SE
- 2226 Kestrel Dr SE
- 2409 Kestrel Dr SE
- 2421 Kestrel Dr SE
- 3109 Bever Ave SE
- 384 31st St SE
- 3025 Bever Ave SE
- 3117 Bever Ave SE
- 388 31st St SE
- 3021 Bever Ave SE
- 3121 Bever Ave SE
- 385 32nd St SE
- 387 31st St SE
- 392 31st St SE
- 3112 Bever Ave SE
- 3019 Bever Ave SE
- 393 32nd St SE
- 3030 Bever Ave SE
- 3120 Bever Ave SE
- 393 31st St SE
- 3015 Bever Ave SE
- 3020 Bever Ave SE
- 372 31st St SE
- 384 30th St SE