A
Seller's Agent in 2025
Abbas Anjarwala
Greatways Realty Inc
(630) 673-1346
1 in this area
23 Total Sales
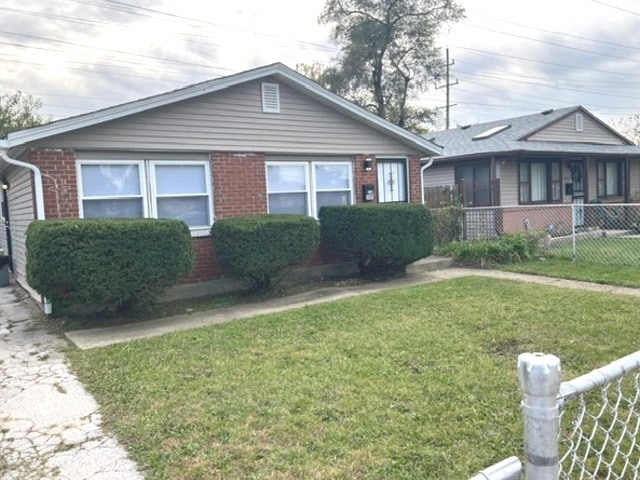
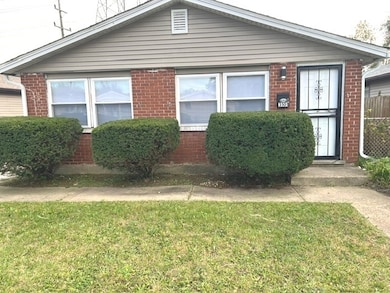
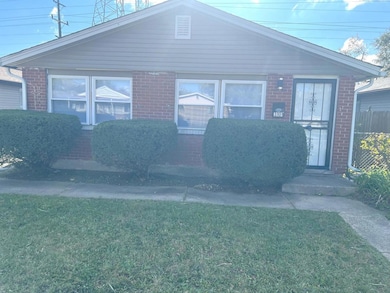
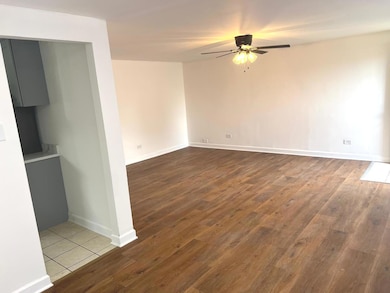
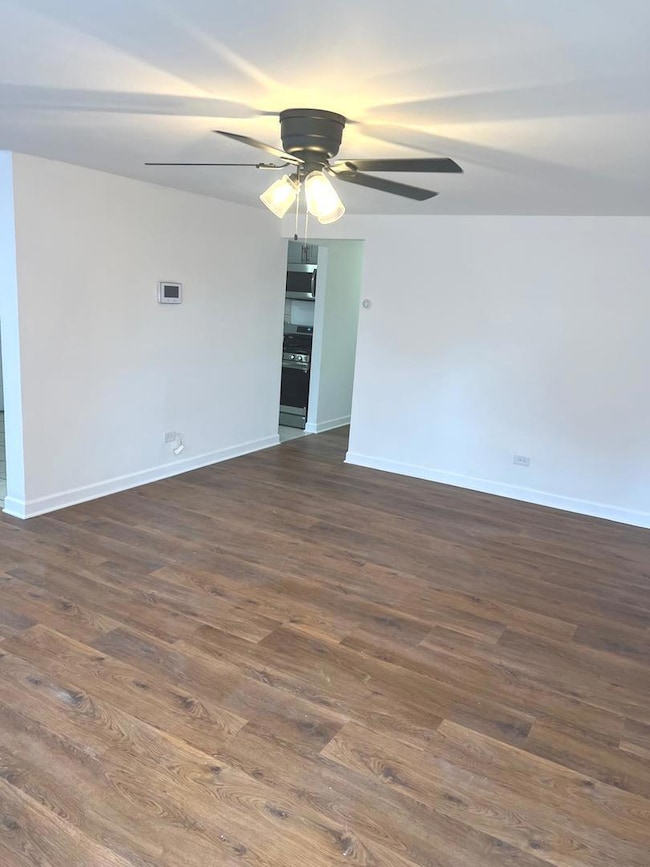
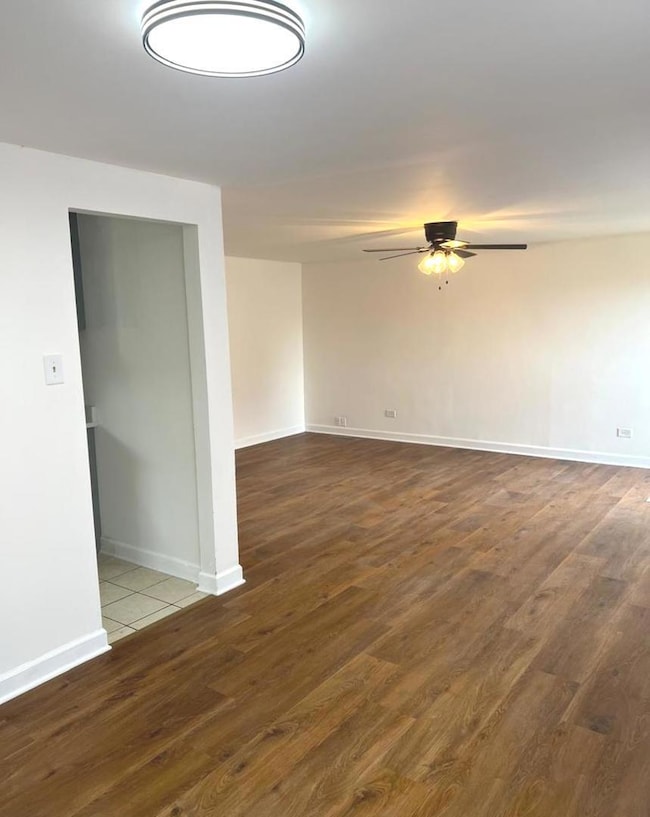
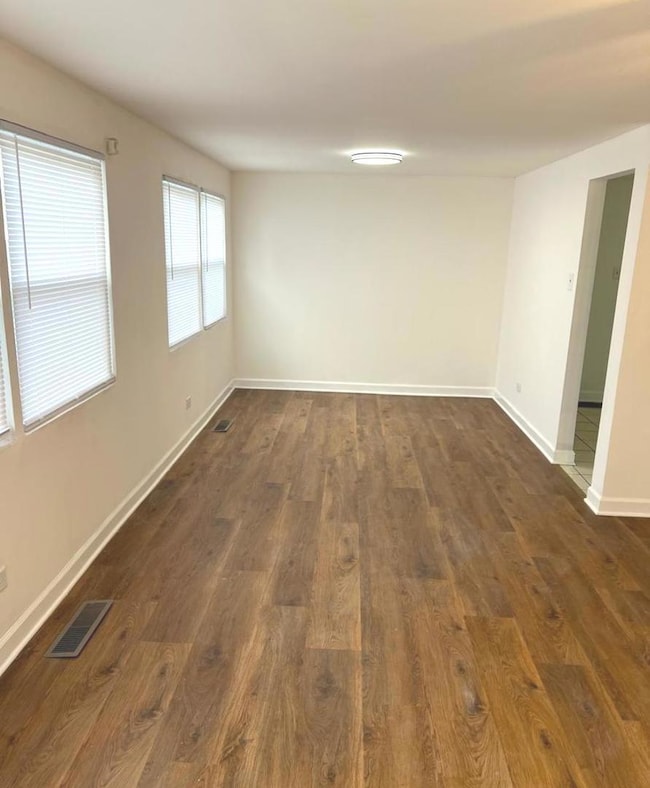
JUST IN TIME FOR THE HOLIDAY SEASON NEWLY REHABBED 3 BEDROOM RANCH. BRAND NEW KITCHEN WITH GRANITE COUNTER TOP AND SS APPLIANCES. COMPLETE NEW FLOORING, ALL NEW WINDOWS, PAINT AND ROOF. NOTHING TO DO JUST MOVE IN QUIET ESTABLISHED NEIGHBORHOOD. BEAUTIFUL STARTER HOME OWN IT FOR CHEAPER THAN RENT OR RENT IT OUT. GREAT INVESTMENT OPPORTUNITY!!! NOTE TAXES ARE WITHOUT HOME OWNER'S EXEMPTION.
Last Agent to Sell the Property
Greatways Realty Inc License #475135003 Listed on: 10/28/2025
| Date | Type | Sale Price | Title Company |
|---|---|---|---|
| Warranty Deed | $140,000 | Chicago Title | |
| Interfamily Deed Transfer | -- | None Available | |
| Special Warranty Deed | $27,000 | Multiple | |
| Legal Action Court Order | -- | Ticor | |
| Interfamily Deed Transfer | -- | Lawyers Title Insurance Corp | |
| Interfamily Deed Transfer | -- | Lenders Title Guaranty |
| Date | Status | Loan Amount | Loan Type |
|---|---|---|---|
| Open | $133,000 | New Conventional | |
| Previous Owner | $26,250 | No Value Available | |
| Previous Owner | $19,000 | No Value Available |
| Date | Event | Price | List to Sale | Price per Sq Ft |
|---|---|---|---|---|
| 12/30/2025 12/30/25 | Sold | $140,000 | -3.4% | $122 / Sq Ft |
| 12/03/2025 12/03/25 | Pending | -- | -- | -- |
| 11/21/2025 11/21/25 | For Sale | $145,000 | 0.0% | $127 / Sq Ft |
| 11/16/2025 11/16/25 | Pending | -- | -- | -- |
| 10/28/2025 10/28/25 | For Sale | $145,000 | -- | $127 / Sq Ft |
| Year | Tax Paid | Tax Assessment Tax Assessment Total Assessment is a certain percentage of the fair market value that is determined by local assessors to be the total taxable value of land and additions on the property. | Land | Improvement |
|---|---|---|---|---|
| 2025 | $2,763 | $7,500 | $900 | $6,600 |
| 2024 | $2,763 | $7,500 | $900 | $6,600 |
| 2023 | $1,846 | $7,500 | $900 | $6,600 |
| 2022 | $1,846 | $3,935 | $800 | $3,135 |
| 2021 | $1,742 | $3,935 | $800 | $3,135 |
| 2020 | $1,692 | $3,935 | $800 | $3,135 |
| 2019 | $2,443 | $5,447 | $700 | $4,747 |
| 2018 | $2,340 | $5,447 | $700 | $4,747 |
| 2017 | $2,387 | $5,447 | $700 | $4,747 |
| 2016 | $2,232 | $5,028 | $600 | $4,428 |
| 2015 | $2,224 | $5,028 | $600 | $4,428 |
| 2014 | $2,197 | $5,028 | $600 | $4,428 |
| 2013 | $1,870 | $4,699 | $600 | $4,099 |
A
Seller's Agent in 2025
Abbas Anjarwala
Greatways Realty Inc
(630) 673-1346
1 in this area
23 Total Sales

Buyer's Agent in 2025
Alejandrina Almaraz Reveles
Midwest SignatureProperties Co
(773) 987-1235
1 in this area
52 Total Sales
Buyer Co-Listing Agent in 2025
Karla Nevarez
Midwest SignatureProperties Co
(708) 712-1667
1 in this area
142 Total Sales
Source: Midwest Real Estate Data (MRED)
MLS Number: 12505610
APN: 28-02-423-015-0000
Disclaimer: Certain information contained herein is derived from information provided by parties other than Homes.com. All information provided is deemed reliable, but is not guaranteed to be accurate and should be independently verified.
![]() Based on information submitted to the MLS GRID. All data is obtained from various sources and may not have been verified by broker or MLS GRID. Supplied Open House Information is subject to change without notice. All information should be independently reviewed and verified for accuracy. Properties may or may not be listed by the office/agent presenting the information. Some IDX listings have been excluded from this website.
Based on information submitted to the MLS GRID. All data is obtained from various sources and may not have been verified by broker or MLS GRID. Supplied Open House Information is subject to change without notice. All information should be independently reviewed and verified for accuracy. Properties may or may not be listed by the office/agent presenting the information. Some IDX listings have been excluded from this website.
Based on information submitted to the MLS GRID
Ask me questions while you tour the home.