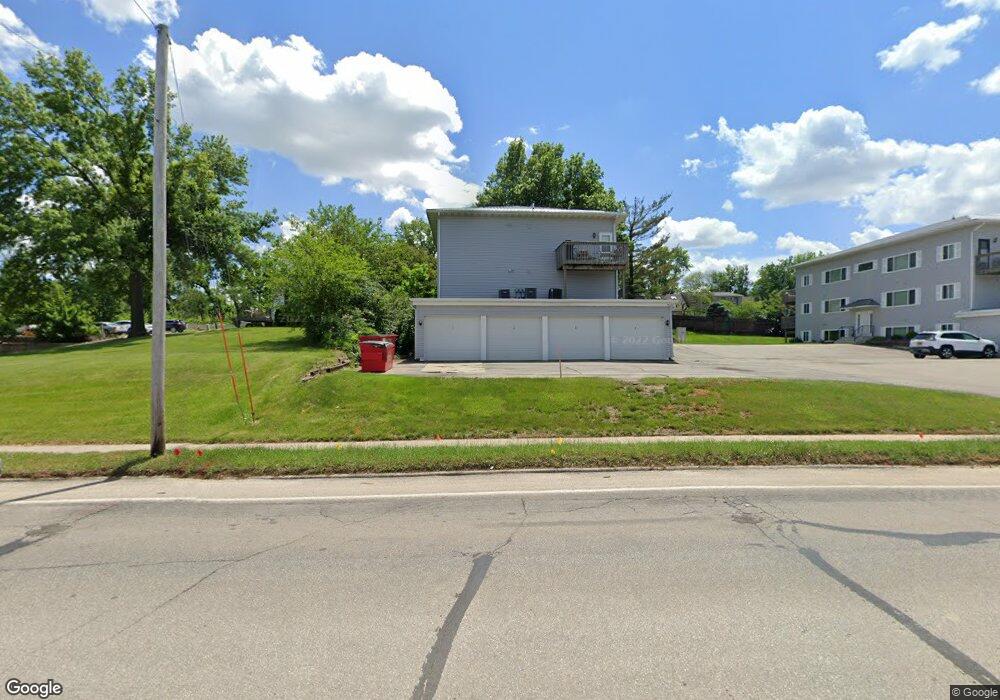
3101 Johnson Ave NW Cedar Rapids, IA 52405
Estimated Value: $91,814 - $109,000
2
Beds
1
Bath
866
Sq Ft
$113/Sq Ft
Est. Value
About This Home
This home is located at 3101 Johnson Ave NW, Cedar Rapids, IA 52405 and is currently estimated at $97,704, approximately $112 per square foot. 3101 Johnson Ave NW is a home located in Linn County with nearby schools including Junction City Elementary School, Cleveland Elementary School, and Kentucky Tech - Ashland Reg Tech Center.
Ownership History
Date
Name
Owned For
Owner Type
Purchase Details
Closed on
Jun 6, 2017
Sold by
Lipari David P
Bought by
Weigand Cory A
Current Estimated Value
Home Financials for this Owner
Home Financials are based on the most recent Mortgage that was taken out on this home.
Original Mortgage
$58,800
Outstanding Balance
$47,843
Interest Rate
3.25%
Mortgage Type
Adjustable Rate Mortgage/ARM
Estimated Equity
$49,861
Purchase Details
Closed on
Oct 22, 2016
Sold by
Callahan Terri L
Bought by
Lipari David P
Purchase Details
Closed on
Jul 10, 2009
Sold by
Sks Properties Llc
Bought by
Caliahan Terri L
Home Financials for this Owner
Home Financials are based on the most recent Mortgage that was taken out on this home.
Original Mortgage
$72,165
Interest Rate
5.37%
Mortgage Type
New Conventional
Create a Home Valuation Report for This Property
The Home Valuation Report is an in-depth analysis detailing your home's value as well as a comparison with similar homes in the area
Home Values in the Area
Average Home Value in this Area
Purchase History
| Date | Buyer | Sale Price | Title Company |
|---|---|---|---|
| Weigand Cory A | -- | None Available | |
| Lipari David P | $73,500 | None Available | |
| Caliahan Terri L | $84,500 | None Available |
Source: Public Records
Mortgage History
| Date | Status | Borrower | Loan Amount |
|---|---|---|---|
| Open | Weigand Cory A | $58,800 | |
| Previous Owner | Caliahan Terri L | $72,165 | |
| Previous Owner | Caliahan Terri L | $12,735 |
Source: Public Records
Tax History Compared to Growth
Tax History
| Year | Tax Paid | Tax Assessment Tax Assessment Total Assessment is a certain percentage of the fair market value that is determined by local assessors to be the total taxable value of land and additions on the property. | Land | Improvement |
|---|---|---|---|---|
| 2025 | $1,260 | $98,800 | $16,000 | $82,800 |
| 2024 | $1,510 | $83,800 | $11,000 | $72,800 |
| 2023 | $1,510 | $81,700 | $11,000 | $70,700 |
| 2022 | $1,482 | $80,500 | $11,000 | $69,500 |
| 2021 | $1,532 | $80,500 | $11,000 | $69,500 |
| 2020 | $1,532 | $78,000 | $11,000 | $67,000 |
| 2019 | $1,576 | $73,100 | $11,000 | $62,100 |
| 2018 | $1,272 | $73,100 | $11,000 | $62,100 |
| 2017 | $1,272 | $65,900 | $5,000 | $60,900 |
| 2016 | $1,507 | $74,200 | $5,000 | $69,200 |
| 2015 | $1,495 | $73,560 | $5,000 | $68,560 |
| 2014 | $1,310 | $89,246 | $5,000 | $84,246 |
| 2013 | $1,602 | $89,246 | $5,000 | $84,246 |
Source: Public Records
Map
Nearby Homes
- 225 31st St NW
- 3107 Johnson Ave NW Unit 4
- 232 27th St NW
- 201 Edgewood Rd NW
- 327 NW Edgewood Rd Unit 324, 330, 336, 342 C
- 3013 Sue Ln NW
- 425 28th St NW
- 159 26th St NW
- 1410 Adair Ct SW Unit Lot 2
- 3416 Sue Ln NW
- 312 24th Ave NW
- 3600 Midway Dr NW
- 3509 E Ave NW Unit D
- 3507 E Ave NW Unit F
- 615 27th St NW
- 623 27th St NW
- 451 23rd St NW
- 2433 8th Ave SW
- 3403 1st Ave SW
- 3312 G Ave NW
- 3101 Johnson Ave NW
- 3101 Johnson Ave NW
- 3101 Johnson Ave NW Unit 31013
- 3101 Johnson Ave NW Unit 31012
- 3101 Johnson Ave NW Unit 31011
- 3101* Johnson Ave NW
- 3101 Johnson Ave NW Unit F
- 3101 Johnson Ave NW Unit E
- 3101 Johnson Ave NW Unit 3
- 3101 Johnson Ave NW Unit 4
- 3101 Johnson Ave NW Unit 1
- 3101 Johnson Ave NW Unit 2
- 3101 Johnson Ave NW Unit 5
- 3101 Johnson Ave NW Unit 6
- 3015 Johnson Ave NW
- 3107 Johnson Ave NW
- 3107 Johnson Ave NW Unit 5
- 3107 Johnson Ave NW
- 3107 Johnson Ave NW Unit 1
- 3107 Johnson Ave NW Unit 6