


3101 W Mansfield Dr Muncie, IN 47304
3
Beds
2
Baths
1,524
Sq Ft
0.26
Acres
Highlights
- Deck
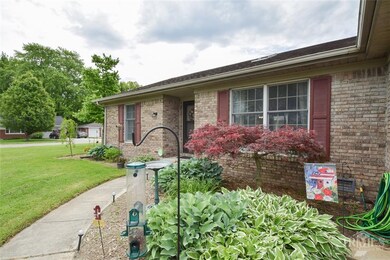
- Ranch Style House
- Walk-In Closet
- Vaulted Ceiling
- 2 Car Attached Garage
- 3-minute walk to Storer Playground
About This Home
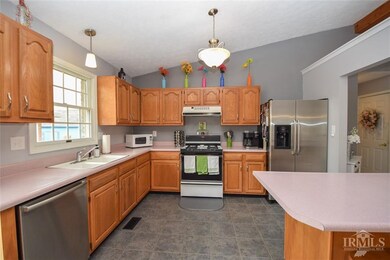
As of April 2024Well maintained 3 BR 2 BA brick home on Muncie's northwest side! As you enter, you're greeted by the spacious living room with vaulted ceiling, wood burning fireplace, and lots of natural light that opens up to the kitchen and dining area. The kitchen features lots of cabinets, countertop space, and breakfast bar. Spacious master bedroom with double walk-in closets and master bath. 2 additional nice sized bedrooms and a full bath. Lots of fresh paint and new light fixtures. Outside you will love the corner lot, deck - great for entertaining, and storage shed. 2-car attached garage. Great location located near BSU, BMH, shopping, and restaurants! Won't last long!
Home Details
Home Type
- Single Family
Est. Annual Taxes
- $1,436
Year Built
- Built in 1992
Parking
- 2 Car Attached Garage
Home Design
- Ranch Style House
- Brick Exterior Construction
Interior Spaces
- 1,524 Sq Ft Home
- Vaulted Ceiling
- Living Room with Fireplace
- Combination Kitchen and Dining Room
- Crawl Space
Kitchen
- Gas Oven
- Dishwasher
Bedrooms and Bathrooms
- 3 Bedrooms
- Walk-In Closet
- 2 Full Bathrooms
Laundry
- Laundry on main level
- Dryer
- Washer
Utilities
- Forced Air Heating and Cooling System
- Heating System Uses Gas
- Gas Water Heater
Additional Features
- Deck
- 0.26 Acre Lot
Community Details
- Sunset Knoll Subdivision
Listing and Financial Details
- Assessor Parcel Number 181105355002000003
Ownership History
Date
Name
Owned For
Owner Type
Purchase Details
Listed on
Mar 13, 2024
Closed on
Apr 24, 2024
Sold by
Le Loan
Bought by
Gehring Cole and Gehring Jansen
Seller's Agent
Tom Oliver
NextHome Elite Real Estate
Buyer's Agent
Joanne Belli
Nottingham Realty Group
List Price
$214,999
Sold Price
$205,000
Premium/Discount to List
-$9,999
-4.65%
Views
80
Current Estimated Value
Home Financials for this Owner
Home Financials are based on the most recent Mortgage that was taken out on this home.
Estimated Appreciation
$16,014
Avg. Annual Appreciation
3.04%
Original Mortgage
$164,000
Outstanding Balance
$162,399
Interest Rate
6.74%
Mortgage Type
New Conventional
Estimated Equity
$50,421
Purchase Details
Listed on
Jul 21, 2021
Closed on
Aug 5, 2021
Sold by
Carlson Kristen T
Bought by
Le Loan
Seller's Agent
Ryan Orr
RE/MAX Real Estate Groups
Buyer's Agent
Rich Lee
RE/MAX Real Estate Groups
List Price
$169,900
Sold Price
$165,000
Premium/Discount to List
-$4,900
-2.88%
Home Financials for this Owner
Home Financials are based on the most recent Mortgage that was taken out on this home.
Avg. Annual Appreciation
8.31%
Purchase Details
Listed on
Feb 24, 2020
Closed on
May 6, 2020
Sold by
Stankewitz Richard L
Bought by
Carlson Kristen T
Seller's Agent
Susan Volbrecht
RE/MAX Real Estate Groups
Buyer's Agent
Aaron Orr
RE/MAX Real Estate Groups
List Price
$135,000
Sold Price
$135,000
Home Financials for this Owner
Home Financials are based on the most recent Mortgage that was taken out on this home.
Avg. Annual Appreciation
17.41%
Original Mortgage
$130,950
Interest Rate
3.5%
Mortgage Type
New Conventional
Similar Homes in Muncie, IN
Create a Home Valuation Report for This Property
The Home Valuation Report is an in-depth analysis detailing your home's value as well as a comparison with similar homes in the area
Home Values in the Area
Average Home Value in this Area
Purchase History
| Date | Type | Sale Price | Title Company |
|---|---|---|---|
| Warranty Deed | $205,000 | None Listed On Document | |
| Warranty Deed | $165,000 | None Available | |
| Warranty Deed | -- | None Available |
Source: Public Records
Mortgage History
| Date | Status | Loan Amount | Loan Type |
|---|---|---|---|
| Open | $164,000 | New Conventional | |
| Previous Owner | $130,950 | New Conventional |
Source: Public Records
Property History
| Date | Event | Price | Change | Sq Ft Price |
|---|---|---|---|---|
| 04/24/2024 04/24/24 | Sold | $205,000 | -4.7% | $103 / Sq Ft |
| 03/21/2024 03/21/24 | Pending | -- | -- | -- |
| 03/13/2024 03/13/24 | For Sale | $214,999 | +30.3% | $108 / Sq Ft |
| 08/06/2021 08/06/21 | Sold | $165,000 | 0.0% | $108 / Sq Ft |
| 08/06/2021 08/06/21 | Sold | $165,000 | -2.9% | $108 / Sq Ft |
| 07/30/2021 07/30/21 | Pending | -- | -- | -- |
| 07/30/2021 07/30/21 | Pending | -- | -- | -- |
| 07/21/2021 07/21/21 | For Sale | $169,900 | 0.0% | $111 / Sq Ft |
| 07/21/2021 07/21/21 | For Sale | $169,900 | 0.0% | $111 / Sq Ft |
| 06/04/2021 06/04/21 | Price Changed | $169,900 | +4.3% | $111 / Sq Ft |
| 06/03/2021 06/03/21 | Pending | -- | -- | -- |
| 06/01/2021 06/01/21 | For Sale | $162,900 | +20.7% | $107 / Sq Ft |
| 05/06/2020 05/06/20 | Sold | $135,000 | 0.0% | $89 / Sq Ft |
| 04/09/2020 04/09/20 | Pending | -- | -- | -- |
| 04/07/2020 04/07/20 | For Sale | $135,000 | 0.0% | $89 / Sq Ft |
| 02/25/2020 02/25/20 | Pending | -- | -- | -- |
| 02/24/2020 02/24/20 | For Sale | $135,000 | -- | $89 / Sq Ft |
Source: MIBOR Broker Listing Cooperative®
Tax History Compared to Growth
Tax History
| Year | Tax Paid | Tax Assessment Tax Assessment Total Assessment is a certain percentage of the fair market value that is determined by local assessors to be the total taxable value of land and additions on the property. | Land | Improvement |
|---|---|---|---|---|
| 2024 | $2,246 | $212,800 | $24,900 | $187,900 |
| 2023 | $1,908 | $178,400 | $21,600 | $156,800 |
| 2022 | $1,969 | $184,500 | $21,600 | $162,900 |
| 2021 | $1,745 | $162,100 | $24,700 | $137,400 |
| 2020 | $1,554 | $143,000 | $22,400 | $120,600 |
| 2019 | $1,424 | $130,000 | $20,400 | $109,600 |
| 2018 | $1,435 | $131,100 | $20,400 | $110,700 |
| 2017 | $1,375 | $125,100 | $18,700 | $106,400 |
| 2016 | $1,315 | $119,100 | $17,800 | $101,300 |
| 2014 | $1,091 | $103,000 | $13,600 | $89,400 |
| 2013 | -- | $99,500 | $13,600 | $85,900 |
Source: Public Records
Agents Affiliated with this Home
-
T
Seller's Agent in 2024
Tom Oliver
NextHome Elite Real Estate
-
Joanne Belli
J
Buyer's Agent in 2024
Joanne Belli
Nottingham Realty Group
(317) 286-4040
7 Total Sales
-
Ryan Orr
Seller's Agent in 2021
Ryan Orr
RE/MAX Real Estate Groups
(765) 212-1111
530 Total Sales
-
Aaron Orr
Seller's Agent in 2021
Aaron Orr
RE/MAX
(765) 212-1111
751 Total Sales
-
Rich Lee
Buyer's Agent in 2021
Rich Lee
RE/MAX Real Estate Groups
(765) 744-9951
213 Total Sales
-
Susan Volbrecht
Seller's Agent in 2020
Susan Volbrecht
RE/MAX
(765) 749-5948
322 Total Sales
Map
Source: MIBOR Broker Listing Cooperative®
MLS Number: 21800670
APN: 18-11-05-355-002.000-003
Disclaimer: Certain information contained herein is derived from information provided by parties other than Homes.com. All information provided is deemed reliable, but is not guaranteed to be accurate and should be independently verified.
![]() Based on information submitted to the MLS GRID. All data is obtained from various sources and may not have been verified by broker or MLS GRID. Supplied Open House Information is subject to change without notice. All information should be independently reviewed and verified for accuracy. Properties may or may not be listed by the office/agent presenting the information. Some IDX listings have been excluded from this website.
Based on information submitted to the MLS GRID. All data is obtained from various sources and may not have been verified by broker or MLS GRID. Supplied Open House Information is subject to change without notice. All information should be independently reviewed and verified for accuracy. Properties may or may not be listed by the office/agent presenting the information. Some IDX listings have been excluded from this website.
Nearby Homes
- 1808 N Winthrop Rd
- 3106 W Brook Dr
- 2909 W Applewood Ct
- 1303 N Brentwood Ln
- 3541 W Johnson Cir
- 2005 N Duane Rd
- 1304 N Tillotson Ave
- 2809 W Beckett Dr
- 3400 W Petty Rd
- 3305 W Petty Rd
- 3705 W Pettigrew Dr
- 2805 W Berwyn Rd
- 3104 W Amherst Rd
- 3313 W Torquay Rd
- 3308 W Amherst Rd
- 1509 N Mann Ave
- 3608 W Torquay Rd
- 901 N Greenbriar Rd
- 2701 N Richmond Dr
- 4104 W Friar Dr