31011 Everett Ct Unit 12 Hayward, CA 94544
Fairway Park NeighborhoodEstimated Value: $611,000 - $663,708
About This Home
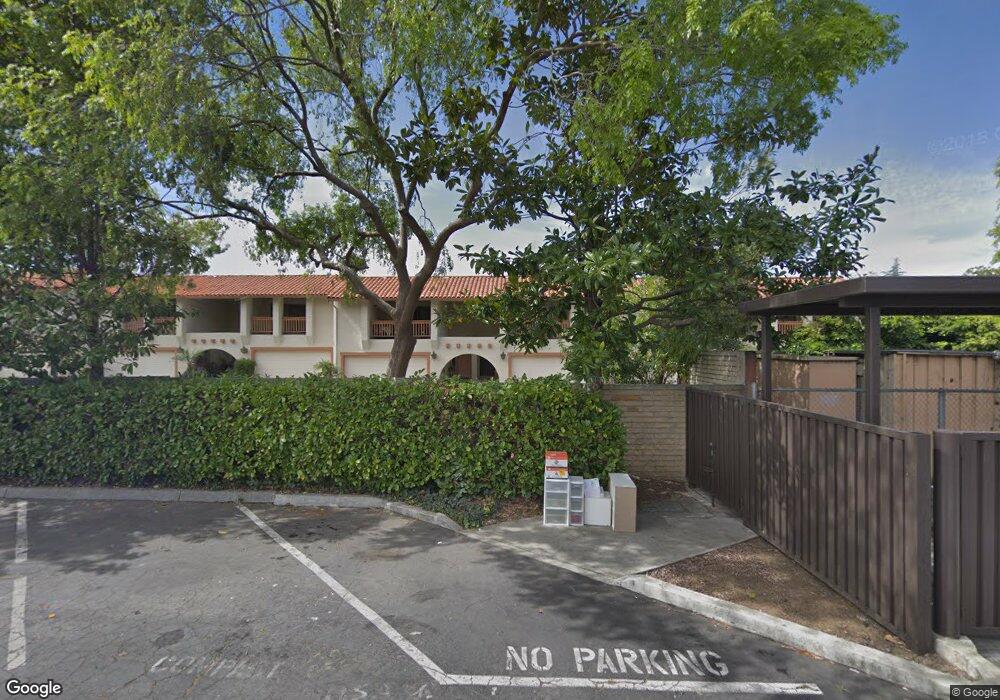
This home is located at 31011 Everett Ct Unit 12, Hayward, CA 94544 and is currently estimated at $629,177, approximately $438 per square foot. 31011 Everett Ct Unit 12 is a home located in Alameda County with nearby schools including Treeview Elementary, Cesar Chavez Middle School, and Tennyson High School.
Ownership History
We collect this data history from publicly available records. To have your information removed, we recommend requesting removal directly through your county’s website.
Purchase Details
Purchase Details
Home Financials for this Owner
Home Financials are based on the most recent Mortgage that was taken out on this home.Purchase Details
Purchase Details
Home Financials for this Owner
Home Financials are based on the most recent Mortgage that was taken out on this home.Home Values in the Area
Average Home Value in this Area
Purchase History
We collect this data history from publicly available records. To have your information removed, we recommend requesting removal directly through your county’s website.
| Date | Buyer | Sale Price | Title Company |
|---|---|---|---|
| -- | None Listed On Document | ||
| $435,000 | First American Title Company | ||
| -- | American Title Co | ||
| -- | American Title Co |
Mortgage History
We collect this data history from publicly available records. To have your information removed, we recommend requesting removal directly through your county’s website.
| Date | Status | Borrower | Loan Amount |
|---|---|---|---|
| Previous Owner | $413,250 | ||
| Previous Owner | $100,000 |
Tax History
We collect this data history from publicly available records. To have your information removed, we recommend requesting removal directly through your county’s website.
| Year | Tax Paid | Tax Assessment Tax Assessment Total Assessment is a certain percentage of the fair market value that is determined by local assessors to be the total taxable value of land and additions on the property. | Land | Improvement |
|---|---|---|---|---|
| 2025 | $6,495 | $507,938 | $154,481 | $360,457 |
| 2024 | $6,495 | $497,843 | $151,453 | $353,390 |
| 2023 | $6,355 | $487,947 | $148,484 | $346,463 |
| 2022 | $6,276 | $478,241 | $145,572 | $339,669 |
| 2021 | $6,135 | $468,728 | $142,718 | $333,010 |
| 2020 | $5,974 | $470,851 | $141,255 | $329,596 |
| 2019 | $6,043 | $461,621 | $138,486 | $323,135 |
| 2018 | $5,922 | $452,573 | $135,772 | $316,801 |
| 2017 | $5,774 | $443,700 | $133,110 | $310,590 |
| 2016 | $2,332 | $181,250 | $59,207 | $122,043 |
| 2015 | $2,295 | $178,528 | $58,318 | $120,210 |
| 2014 | $2,212 | $175,030 | $57,175 | $117,855 |
Map
- 31070 Meadowbrook Ave
- 430 Dutchess Ln
- 506 Caleb Place
- 31139 Chicoine Ave
- 31032 Carroll Ave
- 97 Gresel St
- 30562 Troon Place
- 30544 Hoylake St
- 604 Jilliene Way
- 30532 Carroll Ave
- 31590 Hugh Way
- 31953 Potsdam St
- 722 Gleneagle Ave
- 363 Lafayette Ave
- 29741 Hansen St
- 137 Tamarack Dr
- 29599 Vanderbilt St Unit 204
- 29695 Dixon St
- 29629 Mountain Oak Ct Unit 50
- 169 Tamarack Dr
- 31011 Everett Ct
- 31011 Everett Ct Unit 11
- 31011 Everett Ct Unit 13
- 31011 Everett Ct Unit 11
- 31011 Everett Ct Unit 10
- 31011 Everett Ct Unit 9
- 31011 Everett Ct Unit 8
- 31011 Everett Ct Unit 7
- 31011 Everett Ct Unit 6
- 31011 Everett Ct Unit 5
- 31011 Everett Ct Unit 4
- 31011 Everett Ct Unit 3
- 31011 Everett Ct Unit 2
- 31011 Everett Ct Unit 1
- 31108 Brae Burn Ave
- 31039 Everett Ct Unit 14
- 31039 Everett Ct Unit 15
- 31039 Everett Ct Unit 16
- 356 Rousseau St
- 344 Rousseau St
Ask me questions while you tour the home.