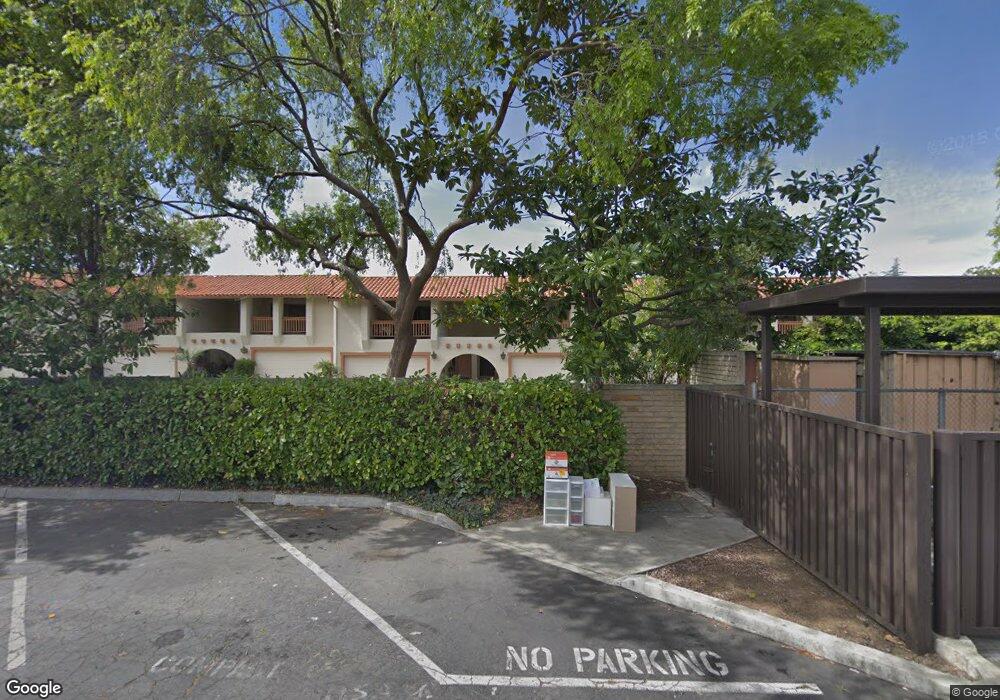
31011 Everett Ct Unit 8 Hayward, CA 94544
Fairway Park NeighborhoodEstimated Value: $493,000 - $641,330
2
Beds
3
Baths
1,435
Sq Ft
$409/Sq Ft
Est. Value
About This Home
This home is located at 31011 Everett Ct Unit 8, Hayward, CA 94544 and is currently estimated at $586,583, approximately $408 per square foot. 31011 Everett Ct Unit 8 is a home located in Alameda County with nearby schools including Treeview Elementary, Cesar Chavez Middle School, and Tennyson High School.
Ownership History
Date
Name
Owned For
Owner Type
Purchase Details
Closed on
Dec 14, 2024
Sold by
Azad Living Trust and Azad Manouchehr
Bought by
Slkk Family Revocable Living Trust and Azad
Current Estimated Value
Purchase Details
Closed on
May 24, 2022
Sold by
Azad and Ganjbaksh
Bought by
Azad Living Trust
Purchase Details
Closed on
Apr 25, 2017
Sold by
Azad Shadbanou
Bought by
Azad Manouchehr
Purchase Details
Closed on
Nov 25, 2014
Sold by
Thorn Paul J
Bought by
Thorn Paul J
Purchase Details
Closed on
Jul 8, 2009
Sold by
Thorn Paul J
Bought by
Thorn Paul J
Purchase Details
Closed on
Mar 28, 2002
Sold by
Claiborne Isabel R
Bought by
Claiborne Isabel R
Purchase Details
Closed on
Mar 15, 2002
Sold by
Thorn Paul
Bought by
Azad Shadbanou
Create a Home Valuation Report for This Property
The Home Valuation Report is an in-depth analysis detailing your home's value as well as a comparison with similar homes in the area
Home Values in the Area
Average Home Value in this Area
Purchase History
| Date | Buyer | Sale Price | Title Company |
|---|---|---|---|
| Slkk Family Revocable Living Trust | $500,000 | None Listed On Document | |
| Azad Living Trust | -- | None Listed On Document | |
| Azad Manouchehr | $475,000 | None Available | |
| Thorn Paul J | -- | None Available | |
| Thorn Paul J | -- | None Available | |
| Claiborne Isabel R | -- | -- | |
| Thorn Paul | -- | -- | |
| Azad Shadbanou | $415,000 | Old Republic Title Company |
Source: Public Records
Tax History
| Year | Tax Paid | Tax Assessment Tax Assessment Total Assessment is a certain percentage of the fair market value that is determined by local assessors to be the total taxable value of land and additions on the property. | Land | Improvement |
|---|---|---|---|---|
| 2025 | $5,936 | $500,000 | $150,000 | $350,000 |
| 2024 | $5,936 | $472,190 | $141,657 | $330,533 |
| 2023 | $5,848 | $462,931 | $138,879 | $324,052 |
| 2022 | $5,735 | $453,855 | $136,156 | $317,699 |
| 2021 | $5,689 | $444,958 | $133,487 | $311,471 |
| 2020 | $5,627 | $440,397 | $132,119 | $308,278 |
| 2019 | $5,672 | $431,765 | $129,529 | $302,236 |
| 2018 | $5,325 | $423,300 | $126,990 | $296,310 |
| 2017 | $3,198 | $244,120 | $73,236 | $170,884 |
| 2016 | $3,004 | $239,334 | $71,800 | $167,534 |
| 2015 | $2,946 | $235,740 | $70,722 | $165,018 |
| 2014 | $2,804 | $231,122 | $69,336 | $161,786 |
Source: Public Records
Map
Nearby Homes
- 31518 Medinah St
- 31565 Medinah St
- 677 Fairway St
- 327 Brookview Way
- 31953 Potsdam St
- 674 Gleneagle Ave
- 29629 Mountain Oak Ct Unit 50
- 29621 Red Oak Ct Unit 6
- 699 Fiesta Place
- 675 Alquire Pkwy
- 29583 Vanderbilt St Unit 310
- 257 Bolt Ct
- 242 Bolt Ct
- 673 Royston Ln Unit 233
- 685 Dartmore Ln Unit 165
- 685 Dartmore Ln Unit 365
- 675 Delve Ct
- 721 Delve Ct
- 729 Delve Ct
- 680 Dartmore Ln Unit 260
- 31011 Everett Ct
- 31011 Everett Ct Unit 11
- 31011 Everett Ct Unit 13
- 31011 Everett Ct Unit 12
- 31011 Everett Ct Unit 11
- 31011 Everett Ct Unit 10
- 31011 Everett Ct Unit 7
- 31011 Everett Ct Unit 6
- 31011 Everett Ct Unit 5
- 31011 Everett Ct Unit 4
- 31011 Everett Ct Unit 3
- 31011 Everett Ct Unit 2
- 31011 Everett Ct Unit 1
- 31108 Brae Burn Ave
- 31039 Everett Ct Unit 14
- 31039 Everett Ct Unit 15
- 31039 Everett Ct Unit 16
- 356 Rousseau St
- 344 Rousseau St
- 368 Rousseau St