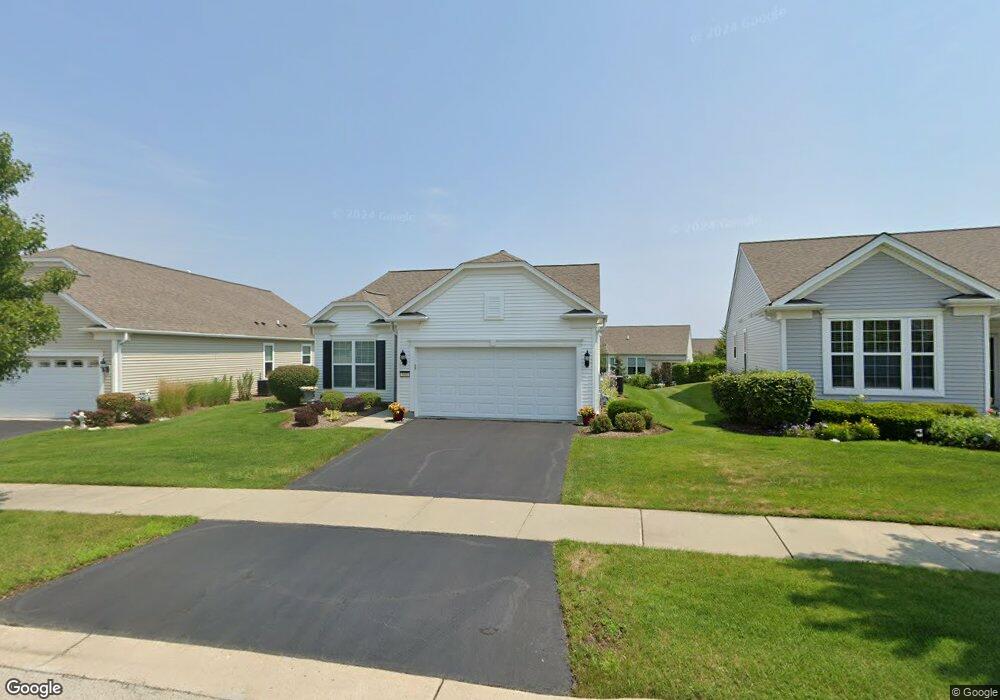
3102 Epstein Cir Mundelein, IL 60060
Ivanhoe NeighborhoodEstimated Value: $422,000 - $479,000
2
Beds
2
Baths
1,320
Sq Ft
$331/Sq Ft
Est. Value
About This Home
This home is located at 3102 Epstein Cir, Mundelein, IL 60060 and is currently estimated at $436,459, approximately $330 per square foot. 3102 Epstein Cir is a home located in Lake County with nearby schools including Fremont Elementary School, Fremont Intermediate School, and Fremont Jr High/Middle School.
Ownership History
Date
Name
Owned For
Owner Type
Purchase Details
Closed on
Mar 1, 2011
Sold by
Dessner Rita
Bought by
Livin Dessner Rita C and Rita C Dessner Revocable Living Trust
Current Estimated Value
Purchase Details
Closed on
Sep 16, 2010
Sold by
Dessner Rita
Bought by
Dessner Rita C
Home Financials for this Owner
Home Financials are based on the most recent Mortgage that was taken out on this home.
Original Mortgage
$198,500
Outstanding Balance
$129,268
Interest Rate
4.17%
Mortgage Type
New Conventional
Estimated Equity
$307,191
Purchase Details
Closed on
Jul 8, 2009
Sold by
Salemi Leroy M and Salemi Mary E
Bought by
Dessner Rita C
Home Financials for this Owner
Home Financials are based on the most recent Mortgage that was taken out on this home.
Original Mortgage
$200,000
Interest Rate
5.29%
Mortgage Type
Unknown
Purchase Details
Closed on
Dec 2, 2008
Sold by
Pulte Home Corporation
Bought by
Salemi Leroy M and Salemi Mary E
Create a Home Valuation Report for This Property
The Home Valuation Report is an in-depth analysis detailing your home's value as well as a comparison with similar homes in the area
Home Values in the Area
Average Home Value in this Area
Purchase History
| Date | Buyer | Sale Price | Title Company |
|---|---|---|---|
| Livin Dessner Rita C | -- | None Available | |
| Dessner Rita C | -- | Regent Title Insurance Agenc | |
| Dessner Rita C | $250,000 | Chicago Title Insurance Co | |
| Salemi Leroy M | $295,000 | None Available |
Source: Public Records
Mortgage History
| Date | Status | Borrower | Loan Amount |
|---|---|---|---|
| Open | Dessner Rita C | $198,500 | |
| Closed | Dessner Rita C | $200,000 |
Source: Public Records
Tax History Compared to Growth
Tax History
| Year | Tax Paid | Tax Assessment Tax Assessment Total Assessment is a certain percentage of the fair market value that is determined by local assessors to be the total taxable value of land and additions on the property. | Land | Improvement |
|---|---|---|---|---|
| 2024 | $8,171 | $115,446 | $40,715 | $74,731 |
| 2023 | $8,171 | $105,778 | $37,305 | $68,473 |
| 2022 | $8,171 | $100,076 | $35,960 | $64,116 |
| 2021 | $7,790 | $96,570 | $34,700 | $61,870 |
| 2020 | $8,065 | $96,791 | $33,745 | $63,046 |
| 2019 | $7,785 | $93,608 | $32,635 | $60,973 |
| 2018 | $7,387 | $90,461 | $30,735 | $59,726 |
| 2017 | $7,299 | $87,614 | $29,768 | $57,846 |
| 2016 | $7,102 | $83,212 | $28,272 | $54,940 |
| 2015 | $6,932 | $78,009 | $26,504 | $51,505 |
| 2014 | $6,527 | $74,275 | $25,225 | $49,050 |
| 2012 | $6,483 | $74,934 | $25,449 | $49,485 |
Source: Public Records
Map
Nearby Homes
- 3263 Eastbank Cir
- 3161 Marshall Ln
- 2982 Ravinia Cir
- 3184 Comstock Ct
- 1067 Kessler Dr
- 1077 Kessler Dr
- 26813 N Chevy Chase Rd
- 1056 Kessler Dr
- 1046 Kessler Dr
- 1066 Kessler Dr
- 1146 Kessler Dr
- 1156 Kessler Dr
- 1093 Joice Ln
- 1084 Joice Ln
- 1103 Joice Ln
- 1166 Kessler Dr
- 1177 Kessler Dr
- 1104 Joice Ln
- 1186 Kessler Dr
- 1114 Joice Ln
- 3112 Epstein Cir
- 3082 Epstein Cir
- 3293 Eastbank Cir
- 3122 Epstein Cir
- 3303 Eastbank Cir
- 3283 Eastbank Cir
- 3072 Epstein Cir
- 3273 Eastbank Cir
- 3132 Epstein Cir
- 3093 Epstein Cir
- 3083 Epstein Cir
- 3103 Epstein Cir
- 3062 Epstein Cir
- 3073 Epstein Cir
- 3142 Epstein Cir
- 3113 Epstein Cir
- 3253 Eastbank Cir
- 3190 Marshall Ln
- 3052 Epstein Cir
- 3123 Epstein Cir