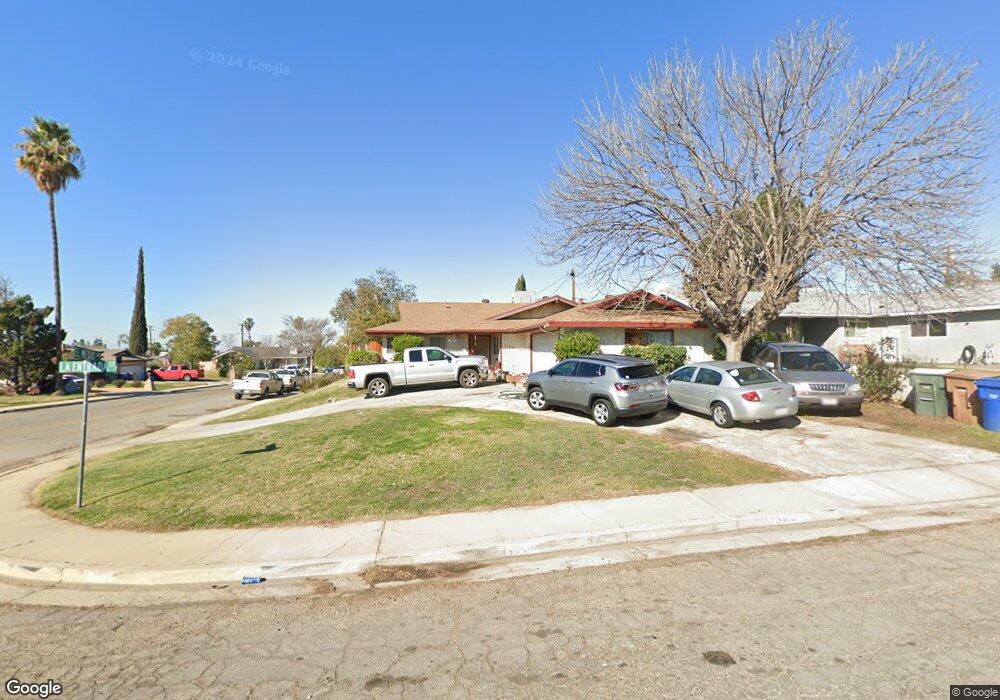
3102 La Entrada Ct Bakersfield, CA 93306
Bakersfield Country Club NeighborhoodEstimated Value: $300,797 - $350,000
3
Beds
2
Baths
1,585
Sq Ft
$205/Sq Ft
Est. Value
About This Home
This home is located at 3102 La Entrada Ct, Bakersfield, CA 93306 and is currently estimated at $324,949, approximately $205 per square foot. 3102 La Entrada Ct is a home located in Kern County with nearby schools including Hort Elementary School, Walter Stiern Middle School, and East Bakersfield High School.
Ownership History
Date
Name
Owned For
Owner Type
Purchase Details
Closed on
Aug 19, 2009
Sold by
Luster Floyd Joe
Bought by
Luster Joy J
Current Estimated Value
Purchase Details
Closed on
Aug 17, 2009
Sold by
Gregg Tracy M and Gregg Michael V
Bought by
Hamilton Penny and Luster Joy J
Purchase Details
Closed on
Jan 13, 2006
Sold by
Mooney Delbert E and Mooney Trudy S
Bought by
Gregg Michael V and Gregg Tracy M
Home Financials for this Owner
Home Financials are based on the most recent Mortgage that was taken out on this home.
Original Mortgage
$185,500
Interest Rate
7.37%
Mortgage Type
Purchase Money Mortgage
Purchase Details
Closed on
Jan 13, 1999
Sold by
Va
Bought by
Mooney Delbert E and Mooney Trudy S
Home Financials for this Owner
Home Financials are based on the most recent Mortgage that was taken out on this home.
Original Mortgage
$40,000
Interest Rate
6.63%
Create a Home Valuation Report for This Property
The Home Valuation Report is an in-depth analysis detailing your home's value as well as a comparison with similar homes in the area
Home Values in the Area
Average Home Value in this Area
Purchase History
| Date | Buyer | Sale Price | Title Company |
|---|---|---|---|
| Luster Joy J | -- | None Available | |
| Hamilton Penny | $103,000 | None Available | |
| Gregg Michael V | $265,000 | Chicago Title | |
| Mooney Delbert E | -- | American Title Co |
Source: Public Records
Mortgage History
| Date | Status | Borrower | Loan Amount |
|---|---|---|---|
| Previous Owner | Gregg Michael V | $185,500 | |
| Previous Owner | Mooney Delbert E | $40,000 |
Source: Public Records
Tax History Compared to Growth
Tax History
| Year | Tax Paid | Tax Assessment Tax Assessment Total Assessment is a certain percentage of the fair market value that is determined by local assessors to be the total taxable value of land and additions on the property. | Land | Improvement |
|---|---|---|---|---|
| 2025 | $2,313 | $132,937 | $38,717 | $94,220 |
| 2024 | $2,255 | $130,331 | $37,958 | $92,373 |
| 2023 | $2,255 | $127,776 | $37,214 | $90,562 |
| 2022 | $2,171 | $125,272 | $36,485 | $88,787 |
| 2021 | $2,075 | $122,817 | $35,770 | $87,047 |
| 2020 | $2,026 | $121,559 | $35,404 | $86,155 |
| 2019 | $1,987 | $121,559 | $35,404 | $86,155 |
| 2018 | $1,926 | $116,840 | $34,030 | $82,810 |
| 2017 | $1,909 | $114,550 | $33,363 | $81,187 |
| 2016 | $1,762 | $112,305 | $32,709 | $79,596 |
| 2015 | $1,757 | $110,619 | $32,218 | $78,401 |
| 2014 | $1,709 | $108,453 | $31,587 | $76,866 |
Source: Public Records
Map
Nearby Homes
- 3112 Ridgedale St
- 3815 Mitchell Ave Unit A,B,C
- 3819 Mitchell Ave
- 3133 Caliente St
- 3826 Oregon St
- 5132 Fernvale Rd
- 5205 Lansdale Dr
- 1323 El Serento Dr
- 3017 Saratoga St
- 2705 Puder St
- 5008 College Ave
- 2605 Puder St
- 1011 Mccurdy Dr
- 4010 Niles St
- 0 Claremont Dr
- 5904 Medio Luna Ave
- 3135 Oregon St
- 2713 Mcnutt St
- 1312 Tate St
- 3423 Monterey St
- 3104 La Entrada Ct
- 3101 Pesante Rd
- 3108 La Entrada Ct
- 3105 Pesante Rd
- 5509 El Medio Ave
- 5513 El Medio Ave
- 3109 Pesante Rd
- 3101 La Entrada Ct
- 5505 El Medio Ave
- 5517 El Medio Ave
- 3105 La Entrada Ct
- 3112 La Entrada Ct
- 5501 El Medio Ave
- 3109 La Entrada Ct
- 5521 El Medio Ave
- 3113 Pesante Rd
- 3200 La Entrada Ct
- 3113 La Entrada Ct
- 5525 El Medio Ave
- 5508 Le Conte Ave