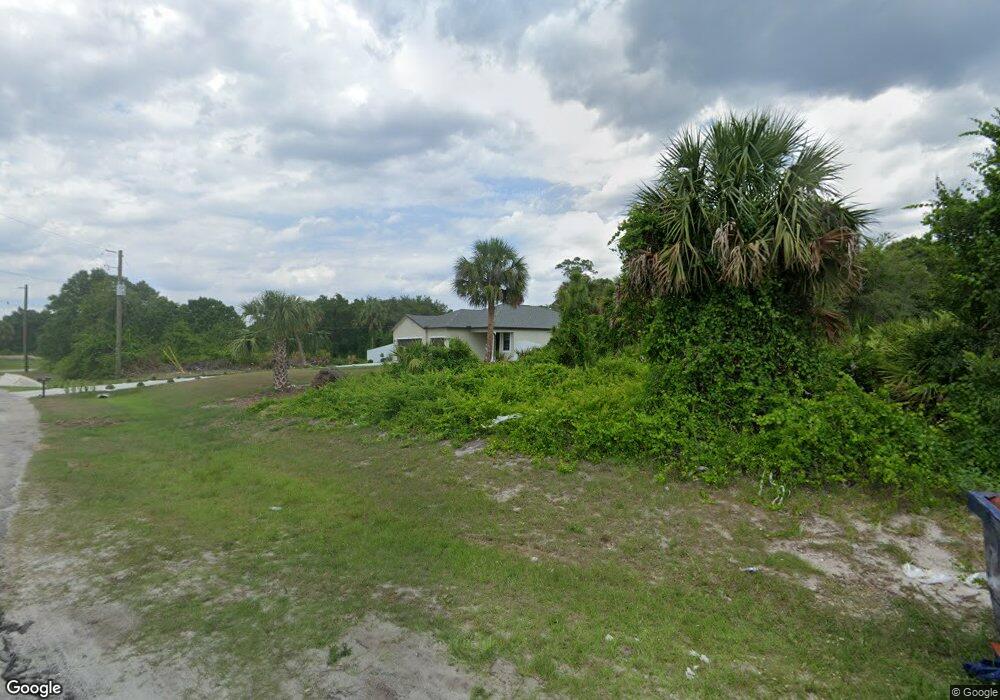
3103 Ivy Ct Labelle, FL 33935
Port LaBelle NeighborhoodEstimated Value: $354,000 - $500,000
3
Beds
2
Baths
1,731
Sq Ft
$227/Sq Ft
Est. Value
About This Home
This home is located at 3103 Ivy Ct, Labelle, FL 33935 and is currently estimated at $393,318, approximately $227 per square foot. 3103 Ivy Ct is a home with nearby schools including Rcma-Mira Verde Coc, Community Christian School, and International Christian Academy of Labelle.
Ownership History
Date
Name
Owned For
Owner Type
Purchase Details
Closed on
Apr 16, 2021
Sold by
Standard Land Development Llc
Bought by
Barrios Katisleidy Rodriguez and Dominguez Yodany
Current Estimated Value
Home Financials for this Owner
Home Financials are based on the most recent Mortgage that was taken out on this home.
Original Mortgage
$265,010
Outstanding Balance
$239,272
Interest Rate
3%
Mortgage Type
FHA
Estimated Equity
$154,046
Purchase Details
Closed on
Aug 31, 2020
Sold by
Index Homes Llc
Bought by
Standard Land Development Llc
Home Financials for this Owner
Home Financials are based on the most recent Mortgage that was taken out on this home.
Original Mortgage
$1,150,626
Interest Rate
3%
Mortgage Type
New Conventional
Purchase Details
Closed on
May 14, 2020
Sold by
Idgas Properties Llc
Bought by
Index Homes Llc
Purchase Details
Closed on
Nov 4, 2010
Sold by
County Of Hendry
Bought by
Winder Vi Llc
Create a Home Valuation Report for This Property
The Home Valuation Report is an in-depth analysis detailing your home's value as well as a comparison with similar homes in the area
Home Values in the Area
Average Home Value in this Area
Purchase History
| Date | Buyer | Sale Price | Title Company |
|---|---|---|---|
| Barrios Katisleidy Rodriguez | $269,900 | Truly Title Inc | |
| Standard Land Development Llc | -- | New Title Company Name | |
| Index Homes Llc | $18,500 | Truly Title Inc | |
| Idgas Properties Llc | -- | Truly Title Inc | |
| Winder Vi Llc | $3,233 | None Available |
Source: Public Records
Mortgage History
| Date | Status | Borrower | Loan Amount |
|---|---|---|---|
| Open | Barrios Katisleidy Rodriguez | $265,010 | |
| Previous Owner | Standard Land Development Llc | $1,150,626 |
Source: Public Records
Tax History Compared to Growth
Tax History
| Year | Tax Paid | Tax Assessment Tax Assessment Total Assessment is a certain percentage of the fair market value that is determined by local assessors to be the total taxable value of land and additions on the property. | Land | Improvement |
|---|---|---|---|---|
| 2024 | $5,135 | $282,771 | -- | -- |
| 2023 | $5,135 | $274,535 | $0 | $0 |
| 2022 | $5,204 | $266,539 | $18,900 | $247,639 |
| 2021 | $249 | $6,800 | $6,800 | $0 |
| 2020 | $197 | $6,000 | $6,000 | $0 |
| 2019 | $191 | $5,400 | $5,400 | $0 |
| 2018 | $179 | $4,400 | $4,400 | $0 |
| 2017 | $176 | $4,200 | $0 | $0 |
| 2016 | $163 | $3,500 | $0 | $0 |
| 2015 | $158 | $3,500 | $0 | $0 |
| 2014 | $147 | $3,000 | $0 | $0 |
Source: Public Records
Map
Nearby Homes
- 3021 June Cir
- 5025 S Peachtree Cir
- 5001 S Peachtree Cir
- 5024 S Peachtree Cir
- 5022 S Peachtree Cir
- 5005 Gunn Cir
- 5003 Gunn Cir
- 5010 S Peachtree Cir
- 5006 S Peachtree Cir
- 5006 Pike Ln
- 5023 Littlefield Rd
- 5017 W Hummingbird Dr
- 3004 Box Ct
- 5033 W Hummingbird Dr
- 3335 Clearview Cir Unit 18
- 5003 Early Ln
- 3005 N Balsam Cir
- 3017 N Balsam Cir
- 3318 Clearview Cir
- 5007 Early Ln