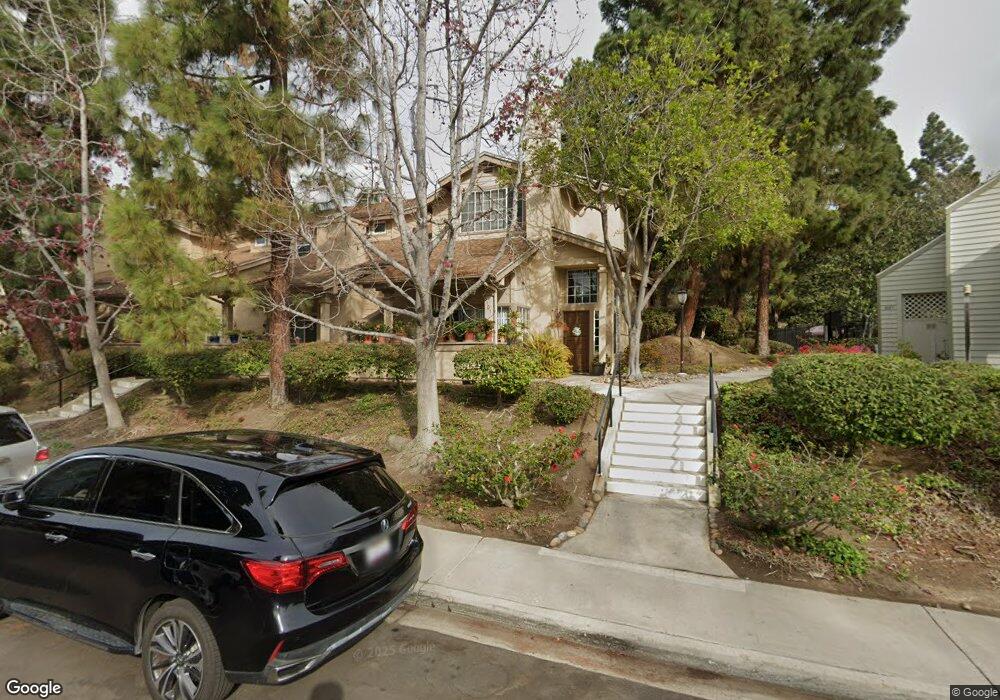
3103 Old Bridgeport Way San Diego, CA 92111
Clairemont Mesa West NeighborhoodEstimated Value: $831,054 - $1,018,000
3
Beds
3
Baths
1,468
Sq Ft
$610/Sq Ft
Est. Value
About This Home
This home is located at 3103 Old Bridgeport Way, San Diego, CA 92111 and is currently estimated at $895,514, approximately $610 per square foot. 3103 Old Bridgeport Way is a home located in San Diego County with nearby schools including Holmes Elementary, Marston Middle School, and Clairemont High School.
Ownership History
Date
Name
Owned For
Owner Type
Purchase Details
Closed on
Dec 4, 2023
Sold by
King Kevin and King Kathryn
Bought by
King Family Trust and King
Current Estimated Value
Purchase Details
Closed on
Aug 25, 2017
Sold by
Donichy Gloria M and Gloria Donichy Trust
Bought by
King Kevin and King Kathryn
Home Financials for this Owner
Home Financials are based on the most recent Mortgage that was taken out on this home.
Original Mortgage
$354,000
Interest Rate
3.93%
Purchase Details
Closed on
Dec 16, 2010
Sold by
Donichy Gloria M
Bought by
Donichy Gloria M
Home Financials for this Owner
Home Financials are based on the most recent Mortgage that was taken out on this home.
Original Mortgage
$110,000
Interest Rate
4.35%
Purchase Details
Closed on
Sep 6, 2005
Sold by
Donichy Gloria M
Bought by
Donichy Gloria M
Purchase Details
Closed on
Oct 6, 2000
Sold by
Donichy Gloria M
Bought by
Donichy Gloria M
Purchase Details
Closed on
Jul 25, 1983
Create a Home Valuation Report for This Property
The Home Valuation Report is an in-depth analysis detailing your home's value as well as a comparison with similar homes in the area
Home Values in the Area
Average Home Value in this Area
Purchase History
| Date | Buyer | Sale Price | Title Company |
|---|---|---|---|
| King Family Trust | -- | None Listed On Document | |
| King Kevin | $519,000 | Chicago Title Company | |
| Donichy Gloria M | -- | Accommodation | |
| Donichy Gloria M | -- | Chicago Title Company | |
| Donichy Gloria M | -- | -- | |
| Donichy Gloria M | -- | -- | |
| -- | $98,000 | -- |
Source: Public Records
Mortgage History
| Date | Status | Borrower | Loan Amount |
|---|---|---|---|
| Previous Owner | King Kevin | $354,000 | |
| Previous Owner | Donichy Gloria M | $110,000 |
Source: Public Records
Tax History Compared to Growth
Tax History
| Year | Tax Paid | Tax Assessment Tax Assessment Total Assessment is a certain percentage of the fair market value that is determined by local assessors to be the total taxable value of land and additions on the property. | Land | Improvement |
|---|---|---|---|---|
| 2025 | $7,056 | $590,525 | $330,077 | $260,448 |
| 2024 | $7,056 | $578,947 | $323,605 | $255,342 |
| 2023 | $6,899 | $567,596 | $317,260 | $250,336 |
| 2022 | $6,714 | $556,468 | $311,040 | $245,428 |
| 2021 | $6,666 | $545,558 | $304,942 | $240,616 |
| 2020 | $6,585 | $539,965 | $301,816 | $238,149 |
| 2019 | $6,466 | $529,379 | $295,899 | $233,480 |
| 2018 | $6,044 | $519,000 | $290,098 | $228,902 |
| 2017 | $80 | $180,553 | $100,921 | $79,632 |
| 2016 | $2,107 | $177,014 | $98,943 | $78,071 |
| 2015 | $1,994 | $174,356 | $97,457 | $76,899 |
| 2014 | $1,961 | $170,941 | $95,548 | $75,393 |
Source: Public Records
Map
Nearby Homes
- 3226 Old Heather Rd
- 3270 W Fox Run Way Unit 2
- 3710 Old Cobble Rd
- 5631 Mount Acara Dr
- 3405 Aveley Place
- 3561 Accomac Ave
- 3635 Mount Abbey Ave
- 3526 Mount Abbey Ave
- 3602 Mount Acadia Blvd
- 6929 Park Mesa Way Unit 126
- 6939 Park Mesa Way Unit 117
- 7016 Park Mesa Way Unit 29
- 2868-70 Preece St
- 7045 Beagle St
- 2818 Nye St
- 2750 Wheatstone St Unit 153
- 2750 Wheatstone St Unit 113
- 2750 Wheatstone St Unit 203
- 2750 Wheatstone St Unit 105
- 2750 Wheatstone St Unit 110
- 3105 Old Bridgeport Way
- 3107 Old Bridgeport Way
- 3101 Old Bridgeport Way
- 3109 Old Bridgeport Way Unit 3
- 3111 Old Bridgeport Way
- 3135 Old Bridgeport Way
- 3139 Old Bridgeport Way
- 3137 Old Bridgeport Way
- 3133 Old Bridgeport Way
- 3113 Old Bridgeport Way
- 3141 Old Bridgeport Way
- 3115 Old Bridgeport Way
- 3143 Old Bridgeport Way
- 3110 Old Bridgeport Way
- 3108 Old Bridgeport Way
- 3112 Old Bridgeport Way
- 3114 Old Bridgeport Way
- 3106 Old Bridgeport Way
- 3118 Old Bridgeport Way
- 3120 Old Bridgeport Way