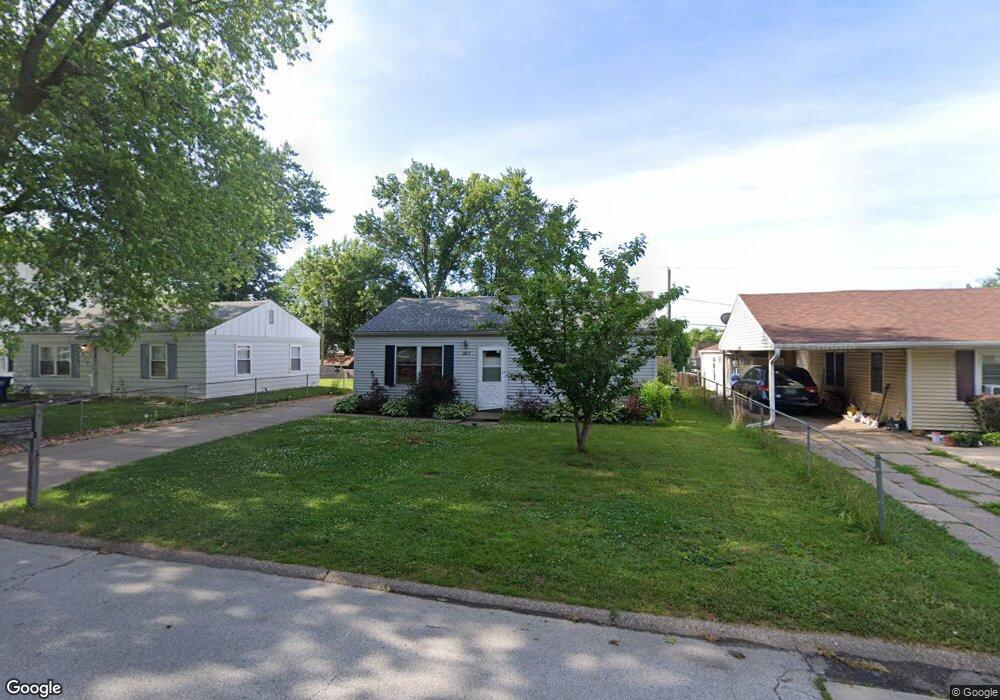
3103 W 67th St Davenport, IA 52806
North Side NeighborhoodEstimated Value: $121,000 - $124,093
2
Beds
1
Bath
792
Sq Ft
$155/Sq Ft
Est. Value
About This Home
This home is located at 3103 W 67th St, Davenport, IA 52806 and is currently estimated at $122,773, approximately $155 per square foot. 3103 W 67th St is a home located in Scott County with nearby schools including Cumberland Hall School, Academy Of Continuing Education, and Wood Intermediate School.
Ownership History
Date
Name
Owned For
Owner Type
Purchase Details
Closed on
Dec 3, 2021
Sold by
Weiser Raymond A and Weiser Jodi A
Bought by
Miller Chadwick E
Current Estimated Value
Home Financials for this Owner
Home Financials are based on the most recent Mortgage that was taken out on this home.
Original Mortgage
$85,500
Outstanding Balance
$78,292
Interest Rate
3.09%
Mortgage Type
New Conventional
Estimated Equity
$44,481
Purchase Details
Closed on
May 20, 2005
Sold by
The Secretary Of Hud
Bought by
Weiser Raymond A and Weiser Jodi A
Home Financials for this Owner
Home Financials are based on the most recent Mortgage that was taken out on this home.
Original Mortgage
$62,100
Interest Rate
6.07%
Mortgage Type
New Conventional
Purchase Details
Closed on
Jan 28, 2005
Sold by
Mers
Bought by
The Secretary Of Hud
Purchase Details
Closed on
Dec 21, 2004
Sold by
Iverson John J
Bought by
Mers
Create a Home Valuation Report for This Property
The Home Valuation Report is an in-depth analysis detailing your home's value as well as a comparison with similar homes in the area
Home Values in the Area
Average Home Value in this Area
Purchase History
| Date | Buyer | Sale Price | Title Company |
|---|---|---|---|
| Miller Chadwick E | $90,000 | None Listed On Document | |
| Weiser Raymond A | -- | None Available | |
| The Secretary Of Hud | $72,000 | None Available | |
| Mers | $84,293 | None Available |
Source: Public Records
Mortgage History
| Date | Status | Borrower | Loan Amount |
|---|---|---|---|
| Open | Miller Chadwick E | $85,500 | |
| Previous Owner | Weiser Raymond A | $62,100 |
Source: Public Records
Tax History Compared to Growth
Tax History
| Year | Tax Paid | Tax Assessment Tax Assessment Total Assessment is a certain percentage of the fair market value that is determined by local assessors to be the total taxable value of land and additions on the property. | Land | Improvement |
|---|---|---|---|---|
| 2025 | $1,766 | $106,590 | $21,150 | $85,440 |
| 2024 | $2,447 | $98,820 | $21,150 | $77,670 |
| 2023 | $2,005 | $98,820 | $21,150 | $77,670 |
| 2022 | $1,818 | $83,810 | $17,180 | $66,630 |
| 2021 | $1,818 | $84,750 | $17,180 | $67,570 |
| 2020 | $1,802 | $82,990 | $17,180 | $65,810 |
| 2019 | $1,796 | $80,050 | $17,180 | $62,870 |
| 2018 | $1,694 | $80,050 | $17,180 | $62,870 |
| 2017 | $1,726 | $77,110 | $17,180 | $59,930 |
| 2016 | $1,664 | $75,940 | $0 | $0 |
| 2015 | $1,664 | $70,750 | $0 | $0 |
| 2014 | $1,572 | $70,750 | $0 | $0 |
| 2013 | $1,544 | $0 | $0 | $0 |
| 2012 | -- | $74,140 | $20,590 | $53,550 |
Source: Public Records
Map
Nearby Homes
- 2822 High Point Dr
- 2714 W 66th St
- Lot 55 Franklin
- 6050 Hillandale Rd
- 000 W 73rd St
- 2508 W 60th Place
- 2514 W 60th St
- 5904 Hillandale Rd
- 5824 Hillandale Rd
- 5812 Hillandale Rd
- 6504 Cedar St
- 2434 W 59th St
- 2110 W 68th St
- 7402 N Pine St
- 2012 W 68th St
- 5556 N Thornwood Ave
- 7319 Volquardsen Ave
- 000 Pacific St
- Lot 65 W 66th St
- 2620 W 54th St