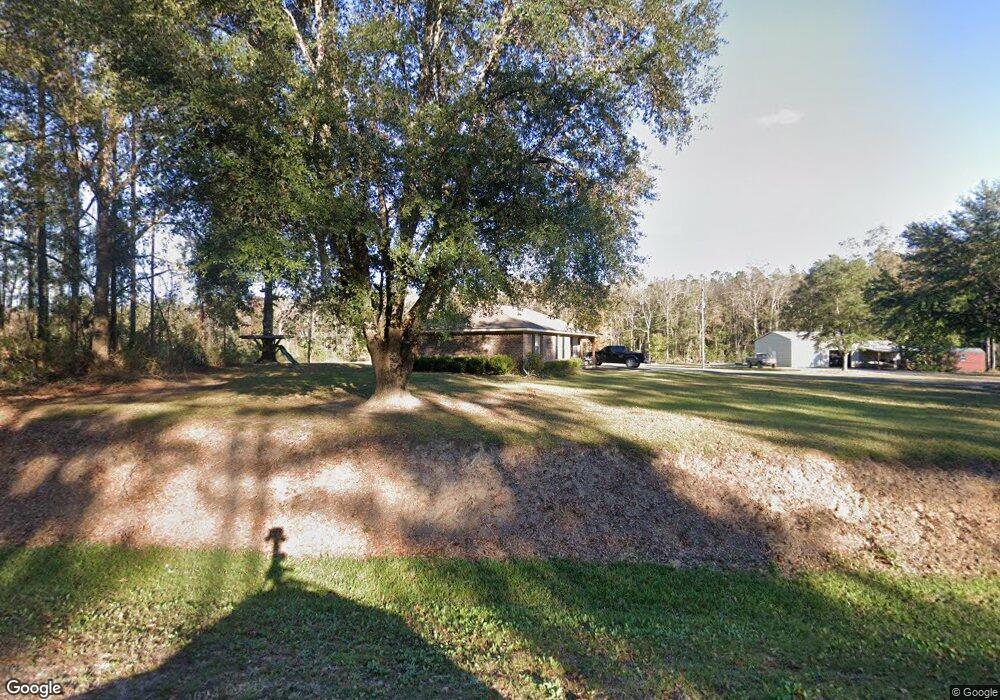
3104 Lanier Rd NE Ludowici, GA 31316
Estimated Value: $193,000 - $284,000
3
Beds
2
Baths
1,444
Sq Ft
$164/Sq Ft
Est. Value
About This Home
This home is located at 3104 Lanier Rd NE, Ludowici, GA 31316 and is currently estimated at $236,262, approximately $163 per square foot. 3104 Lanier Rd NE is a home located in Long County with nearby schools including Smiley Elementary School, McClelland Elementary School, and Long County High School.
Ownership History
Date
Name
Owned For
Owner Type
Purchase Details
Closed on
Jan 20, 2012
Bought by
Freeman Adam B
Current Estimated Value
Home Financials for this Owner
Home Financials are based on the most recent Mortgage that was taken out on this home.
Original Mortgage
$87,718
Outstanding Balance
$61,331
Interest Rate
4.4%
Mortgage Type
FHA
Estimated Equity
$174,931
Purchase Details
Closed on
Mar 1, 2011
Sold by
Chase Home Finance Llc
Bought by
Secretary Of Veterans Affairs
Purchase Details
Closed on
Apr 10, 2009
Sold by
Brady Michael B
Bought by
Chabanik Richard Joseph and Chabanik Marie Arlene
Home Financials for this Owner
Home Financials are based on the most recent Mortgage that was taken out on this home.
Original Mortgage
$141,733
Interest Rate
5.05%
Mortgage Type
VA
Purchase Details
Closed on
Feb 20, 1995
Bought by
Wyatt Steven L
Purchase Details
Closed on
Oct 25, 1994
Bought by
H and I
Create a Home Valuation Report for This Property
The Home Valuation Report is an in-depth analysis detailing your home's value as well as a comparison with similar homes in the area
Home Values in the Area
Average Home Value in this Area
Purchase History
| Date | Buyer | Sale Price | Title Company |
|---|---|---|---|
| Freeman Adam B | -- | -- | |
| Freeman Adam B | -- | -- | |
| Secretary Of Veterans Affairs | $92,537 | -- | |
| Chase Home Finance Llc | $92,537 | -- | |
| Chabanik Richard Joseph | $138,750 | -- | |
| Wyatt Steven L | $72,000 | -- | |
| H | $5,700 | -- |
Source: Public Records
Mortgage History
| Date | Status | Borrower | Loan Amount |
|---|---|---|---|
| Open | Freeman Adam B | $87,718 | |
| Closed | Freeman Adam B | $87,718 | |
| Previous Owner | Chabanik Richard Joseph | $141,733 |
Source: Public Records
Tax History Compared to Growth
Tax History
| Year | Tax Paid | Tax Assessment Tax Assessment Total Assessment is a certain percentage of the fair market value that is determined by local assessors to be the total taxable value of land and additions on the property. | Land | Improvement |
|---|---|---|---|---|
| 2024 | $2,195 | $51,725 | $10,724 | $41,001 |
| 2023 | $1,841 | $51,725 | $10,724 | $41,001 |
| 2022 | $1,841 | $51,725 | $10,724 | $41,001 |
| 2021 | $1,773 | $51,226 | $10,724 | $40,502 |
| 2020 | $1,784 | $51,226 | $10,724 | $40,502 |
| 2019 | $1,784 | $51,226 | $10,724 | $40,502 |
| 2018 | $1,785 | $51,226 | $10,724 | $40,502 |
| 2017 | $1,785 | $51,226 | $10,724 | $40,502 |
| 2016 | $1,733 | $51,226 | $10,724 | $40,502 |
| 2015 | -- | $51,226 | $10,723 | $40,502 |
| 2014 | -- | $51,226 | $10,724 | $40,502 |
| 2013 | -- | $51,226 | $10,723 | $40,502 |
Source: Public Records
Map
Nearby Homes
- 319 Nance Field Cir SE
- 3271 Lanier Rd NE
- 3310 Lanier Rd NE
- 118 Fairview Dr NE
- 2281 Palmer Rd NE
- 2537 Palmer Rd NE
- 1385 Castaway Ct NE
- lot 3 Crossway Pines
- 168 Halcyon Way
- 152 Halcyon Way
- Lot 617 Halcyon Way
- 436 Mcclelland Loop NE
- 380 McCelland Loop
- 18 McCelland Loop
- 389 McCelland Loop
- 363 McCelland Loop
- 448 McCelland Loop
- 439 McCelland Loop
- 413 McCelland Loop
- 404 McCelland Loop