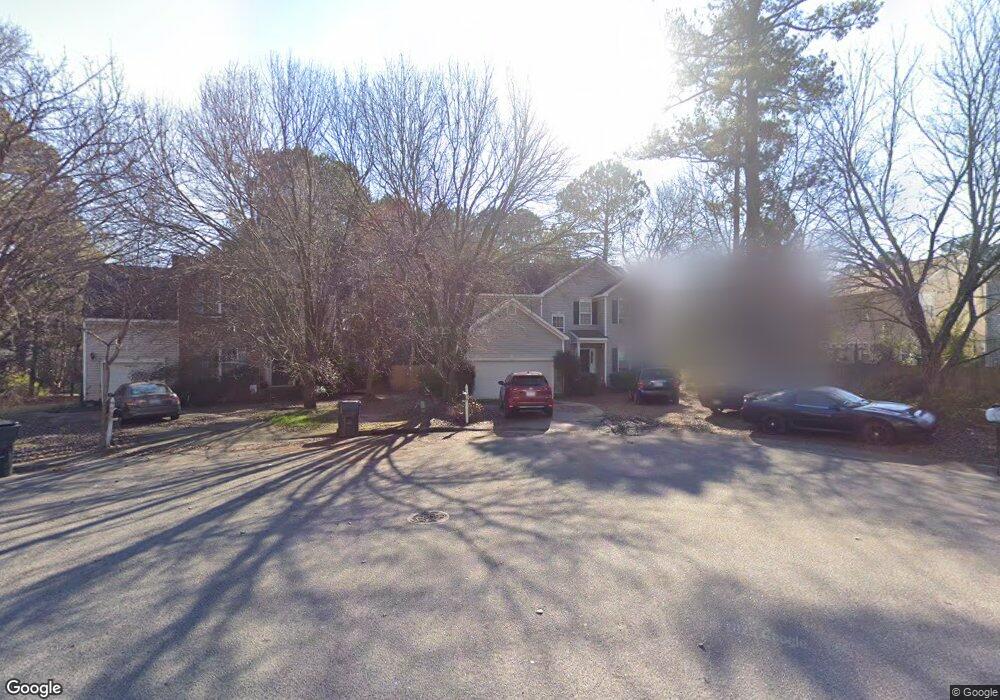
3104 Marbletree Way Raleigh, NC 27604
Northeast Raleigh NeighborhoodEstimated Value: $377,000 - $409,000
4
Beds
3
Baths
1,927
Sq Ft
$204/Sq Ft
Est. Value
About This Home
This home is located at 3104 Marbletree Way, Raleigh, NC 27604 and is currently estimated at $393,074, approximately $203 per square foot. 3104 Marbletree Way is a home located in Wake County with nearby schools including Beaverdam Elementary School, River Bend Middle, and Rolesville High School.
Ownership History
Date
Name
Owned For
Owner Type
Purchase Details
Closed on
Sep 8, 2014
Sold by
Dunemann Jeffrey Michael and Dunemann Christina Lynn
Bought by
American Homes 4 Rent Properties Nine Ll
Current Estimated Value
Purchase Details
Closed on
Jun 29, 2001
Sold by
Herrington William C and Herrington Catherine R
Bought by
Dunemann Jeffrey Michael and Dunemann Christina Lynn
Home Financials for this Owner
Home Financials are based on the most recent Mortgage that was taken out on this home.
Original Mortgage
$166,000
Interest Rate
7.14%
Mortgage Type
VA
Purchase Details
Closed on
Sep 14, 1999
Sold by
Centex Homes
Bought by
Herrington William C and Herrington Catherine R
Home Financials for this Owner
Home Financials are based on the most recent Mortgage that was taken out on this home.
Original Mortgage
$149,600
Interest Rate
7.37%
Create a Home Valuation Report for This Property
The Home Valuation Report is an in-depth analysis detailing your home's value as well as a comparison with similar homes in the area
Home Values in the Area
Average Home Value in this Area
Purchase History
| Date | Buyer | Sale Price | Title Company |
|---|---|---|---|
| American Homes 4 Rent Properties Nine Ll | $177,000 | None Available | |
| Dunemann Jeffrey Michael | $166,000 | -- | |
| Herrington William C | $157,500 | -- |
Source: Public Records
Mortgage History
| Date | Status | Borrower | Loan Amount |
|---|---|---|---|
| Previous Owner | Dunemann Jeffrey Michael | $166,000 | |
| Previous Owner | Herrington William C | $149,600 |
Source: Public Records
Tax History Compared to Growth
Tax History
| Year | Tax Paid | Tax Assessment Tax Assessment Total Assessment is a certain percentage of the fair market value that is determined by local assessors to be the total taxable value of land and additions on the property. | Land | Improvement |
|---|---|---|---|---|
| 2025 | $3,163 | $360,421 | $90,000 | $270,421 |
| 2024 | $3,150 | $360,421 | $90,000 | $270,421 |
| 2023 | $2,396 | $217,962 | $40,000 | $177,962 |
| 2022 | $2,227 | $217,962 | $40,000 | $177,962 |
| 2021 | $2,141 | $217,962 | $40,000 | $177,962 |
| 2020 | $2,102 | $217,962 | $40,000 | $177,962 |
| 2019 | $1,982 | $169,258 | $35,000 | $134,258 |
| 2018 | $1,869 | $169,258 | $35,000 | $134,258 |
| 2017 | $1,781 | $169,258 | $35,000 | $134,258 |
| 2016 | $1,744 | $169,258 | $35,000 | $134,258 |
| 2015 | $1,961 | $187,410 | $40,000 | $147,410 |
| 2014 | -- | $187,410 | $40,000 | $147,410 |
Source: Public Records
Map
Nearby Homes
- 5121 Amberfield Way
- 4913 Knightsbridge Way
- 4905 Knightsbridge Way
- 2712 Kempsford Place
- 511 Edgecreek Ct
- 3017 Barnsley Ln
- 2704 Rockbridge Ct
- 2401 Laurel Valley Way
- 4412 Birmingham Way
- 4309 Birmingham Way
- 2301 Laurel Valley Way
- 2509 Westham Place
- 4948 Southern Magnolia Dr
- 4400 Knightsbridge Way
- 2761 Andover Glen Rd
- 2737 Andover Glen Rd
- 1 Gathering Place
- 4656 Forest Highland Dr
- 3009 Allenby Dr
- 2037 Summer Shire Way
- 3104 Marbletree Ct
- 3108 Marbletree Way
- 4905 Heatherfield Way
- 4909 Heatherfield Way
- 3100 Marbletree Ct
- 3100 Marbletree Way
- 4917 Heatherfield Way
- 3112 Marbletree Ct
- 3112 Marbletree Way
- 4921 Heatherfield Way
- 3105 Marbletree Ct
- 3115 Marbletree Way
- 3109 Marbletree Ct
- 4841 Heatherfield Way
- 3105 Marbletree Way
- 3109 Marbletree Way
- 4901 Heatherfield Way
- 3215 Southall Rd
- 4908 Heatherfield Way
- 4833 Heatherfield Way