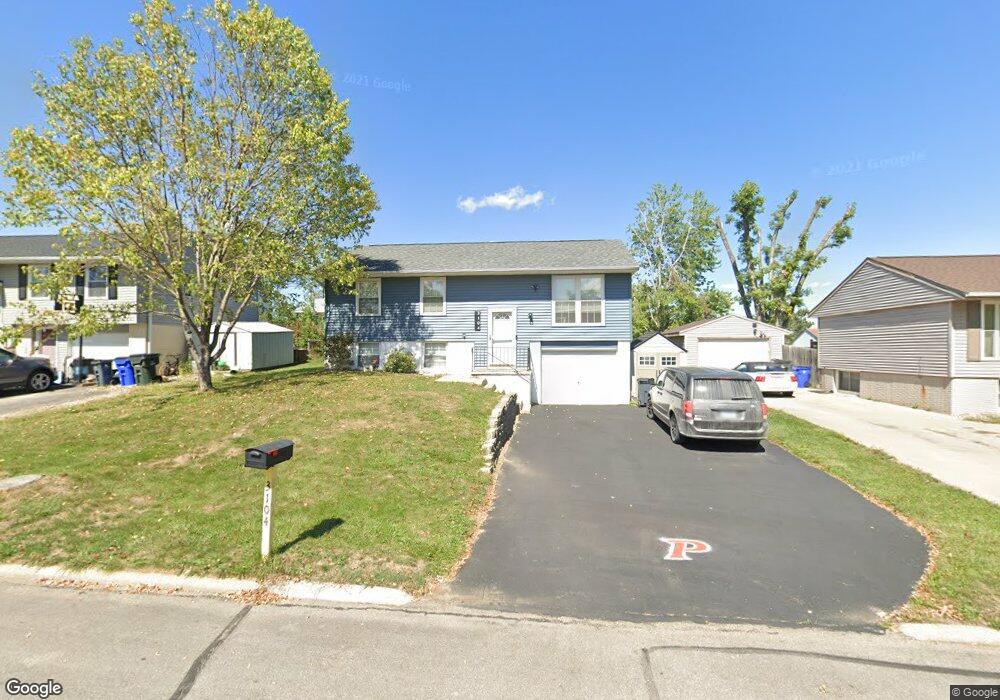
3104 Pebble Dr SW Cedar Rapids, IA 52404
Estimated Value: $192,000 - $218,000
4
Beds
2
Baths
1,400
Sq Ft
$143/Sq Ft
Est. Value
About This Home
This home is located at 3104 Pebble Dr SW, Cedar Rapids, IA 52404 and is currently estimated at $200,734, approximately $143 per square foot. 3104 Pebble Dr SW is a home located in Linn County with nearby schools including Prairie Crest Elementary School, Prairie View Elementary School, and Prairie Ridge Elementary School.
Ownership History
Date
Name
Owned For
Owner Type
Purchase Details
Closed on
May 23, 2008
Sold by
Rodriguez Ana Myrella and Rodriguez Juan C
Bought by
Matheny Matthew A
Current Estimated Value
Home Financials for this Owner
Home Financials are based on the most recent Mortgage that was taken out on this home.
Original Mortgage
$109,450
Outstanding Balance
$69,278
Interest Rate
5.87%
Mortgage Type
Purchase Money Mortgage
Estimated Equity
$131,456
Purchase Details
Closed on
Jan 31, 2003
Sold by
Winchester Michael Z and Winchester Nora L
Bought by
Villalpando Ana M
Home Financials for this Owner
Home Financials are based on the most recent Mortgage that was taken out on this home.
Original Mortgage
$104,176
Interest Rate
6.13%
Mortgage Type
FHA
Purchase Details
Closed on
Sep 21, 2001
Sold by
Golla Gabriel R and Golla Kellie G
Bought by
Winchester Michael Z and Winchester Nora L
Home Financials for this Owner
Home Financials are based on the most recent Mortgage that was taken out on this home.
Original Mortgage
$81,600
Interest Rate
7.06%
Create a Home Valuation Report for This Property
The Home Valuation Report is an in-depth analysis detailing your home's value as well as a comparison with similar homes in the area
Home Values in the Area
Average Home Value in this Area
Purchase History
| Date | Buyer | Sale Price | Title Company |
|---|---|---|---|
| Matheny Matthew A | $115,000 | None Available | |
| Villalpando Ana M | $104,500 | -- | |
| Winchester Michael Z | $102,000 | -- |
Source: Public Records
Mortgage History
| Date | Status | Borrower | Loan Amount |
|---|---|---|---|
| Open | Matheny Matthew A | $109,450 | |
| Previous Owner | Villalpando Ana M | $104,176 | |
| Previous Owner | Winchester Michael Z | $81,600 |
Source: Public Records
Tax History Compared to Growth
Tax History
| Year | Tax Paid | Tax Assessment Tax Assessment Total Assessment is a certain percentage of the fair market value that is determined by local assessors to be the total taxable value of land and additions on the property. | Land | Improvement |
|---|---|---|---|---|
| 2025 | $2,854 | $172,600 | $35,300 | $137,300 |
| 2024 | $3,010 | $167,400 | $32,400 | $135,000 |
| 2023 | $3,010 | $161,100 | $32,400 | $128,700 |
| 2022 | $2,756 | $144,700 | $26,800 | $117,900 |
| 2021 | $2,702 | $135,800 | $26,800 | $109,000 |
| 2020 | $2,702 | $127,300 | $24,000 | $103,300 |
| 2019 | $2,594 | $124,200 | $24,000 | $100,200 |
| 2018 | $2,520 | $124,200 | $24,000 | $100,200 |
| 2017 | $2,576 | $123,000 | $24,000 | $99,000 |
| 2016 | $2,517 | $116,300 | $24,000 | $92,300 |
| 2015 | $2,459 | $114,332 | $23,970 | $90,362 |
| 2014 | $2,272 | $119,088 | $23,970 | $95,118 |
| 2013 | $2,254 | $119,088 | $23,970 | $95,118 |
Source: Public Records
Map
Nearby Homes
- 3009 Carriage Dr SW
- 3108 Huxley Ln SW
- 3132 Pebble Dr SW
- 2812 29th Ave SW
- 3221 Bramble Rd SW
- 3226 Bramble Rd SW
- 3205 33rd Ave SW
- 3405 Queen Dr SW
- 3619 King Dr SW
- 2521 Radcliffe Ct SW
- 3302 Sokol Ln SW
- 3715 33rd Ave SW Unit 4.8 AC
- 3715 33rd Ave SW Unit 5.8 AC
- 3715 33rd Ave SW Unit 1 AC
- 3406 Sokol Ln SW
- 3737 Monarch Dr SW
- 3315 Sokol Ln SW
- 3321 Sokol Ln SW
- 3424 Sokol Ln SW
- 3502 Sokol Ln SW
- 3108 Pebble Dr SW
- 3100 Pebble Dr SW
- 3105 Carriage Dr SW
- 3109 Carriage Dr SW
- 3101 Carriage Dr SW
- 3024 Pebble Dr SW
- 3112 Pebble Dr SW
- 3103 Pebble Dr SW
- 3025 Carriage Dr SW
- 3113 Carriage Dr SW
- 3107 Pebble Dr SW
- 3116 Pebble Dr SW
- 3111 Pebble Dr SW
- 3023 Pebble Dr SW
- 3019 Carriage Dr SW
- 3117 Carriage Dr SW
- 3115 Pebble Dr SW
- 3120 Pebble Dr SW
- 3017 Pebble Dr SW
- 3106 Carriage Dr SW Unit II