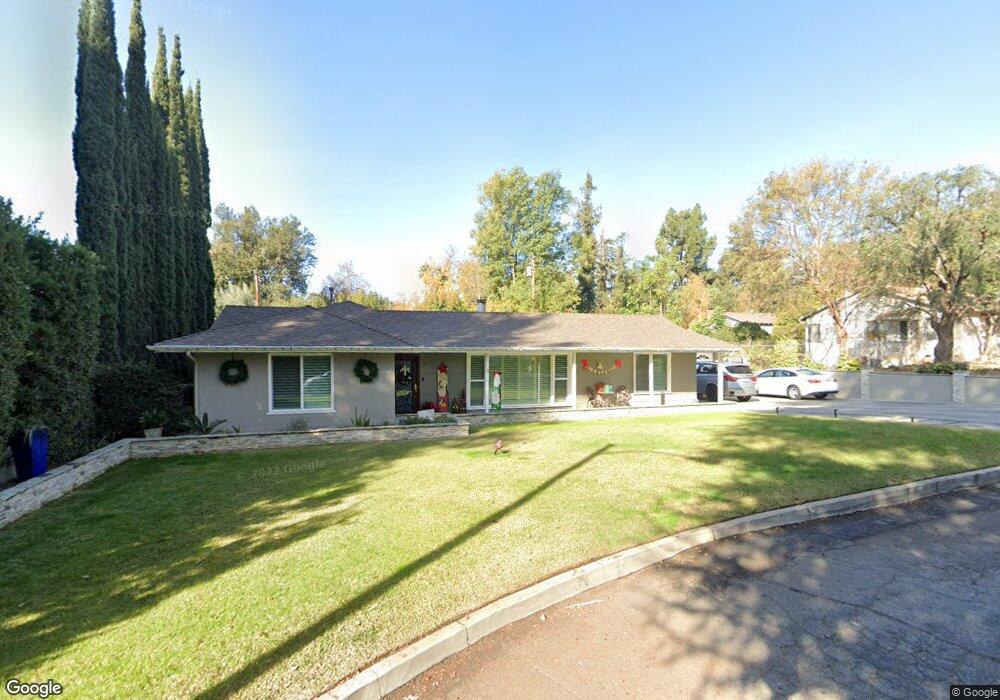
3105 Highview Ave Altadena, CA 91001
Estimated Value: $625,000 - $1,268,971
3
Beds
2
Baths
2,088
Sq Ft
$405/Sq Ft
Est. Value
About This Home
This home is located at 3105 Highview Ave, Altadena, CA 91001 and is currently estimated at $845,657, approximately $405 per square foot. 3105 Highview Ave is a home located in Los Angeles County with nearby schools including Altadena Arts Magnet Elementary, Charles W. Eliot Arts Magnet Academy, and John Muir High School.
Ownership History
Date
Name
Owned For
Owner Type
Purchase Details
Closed on
Dec 9, 2002
Sold by
Reevers Elmer L and Reevers Dorothy D
Bought by
Bailey Rod Damian and Bailey Toya Shonte
Current Estimated Value
Home Financials for this Owner
Home Financials are based on the most recent Mortgage that was taken out on this home.
Original Mortgage
$316,000
Interest Rate
6.99%
Create a Home Valuation Report for This Property
The Home Valuation Report is an in-depth analysis detailing your home's value as well as a comparison with similar homes in the area
Home Values in the Area
Average Home Value in this Area
Purchase History
| Date | Buyer | Sale Price | Title Company |
|---|---|---|---|
| Bailey Rod Damian | $395,000 | First American Title Co |
Source: Public Records
Mortgage History
| Date | Status | Borrower | Loan Amount |
|---|---|---|---|
| Previous Owner | Bailey Rod Damian | $316,000 |
Source: Public Records
Tax History
| Year | Tax Paid | Tax Assessment Tax Assessment Total Assessment is a certain percentage of the fair market value that is determined by local assessors to be the total taxable value of land and additions on the property. | Land | Improvement |
|---|---|---|---|---|
| 2025 | $7,056 | $458,073 | $319,671 | $138,402 |
| 2024 | $7,056 | $572,689 | $391,754 | $180,935 |
| 2023 | $6,993 | $561,461 | $384,073 | $177,388 |
| 2022 | $6,758 | $550,453 | $376,543 | $173,910 |
| 2021 | $6,385 | $539,660 | $369,160 | $170,500 |
| 2020 | $6,142 | $534,127 | $365,375 | $168,752 |
| 2019 | $6,152 | $523,655 | $358,211 | $165,444 |
| 2018 | $6,143 | $513,388 | $351,188 | $162,200 |
| 2016 | $5,942 | $493,453 | $337,551 | $155,902 |
| 2015 | $5,877 | $486,042 | $332,481 | $153,561 |
| 2014 | $5,763 | $476,522 | $325,969 | $150,553 |
Source: Public Records
Map
Nearby Homes
- 3010 Highview Ave
- 2971 Emerson Way
- 50 Marathon Rd
- 306 E Las Flores Dr
- 27 W Palm St
- 3262 Raymond Ave
- 275 E Pentagon St
- 3313 Alicia Ave
- 70 W Las Flores Dr
- 411 E Marigold St
- 408 Wistaria Place
- 294 Wapello St
- 3371 Fair Oaks Ave
- 369 E Altadena Dr
- 283 E Mariposa St
- 3241 N Olive Ave
- 752 Via Arezzo Place
- 740 Via Arezzo Place
- 3474 Glenrose Ave
- 2716 Mcnally Ave
- 3121 Highview Ave
- 3079 Highview Ave
- 3100 Highview Ave
- 114 E Las Flores Dr
- 114 1/2 E Las Flores Dr
- 3124 Highview Ave
- 3127 Highview Ave
- 3090 Ewing Ave
- 3080 Highview Ave
- 3071 Highview Ave
- 3108 Ewing Ave
- 3088 Ewing Ave
- 3132 Highview Ave
- 3110 Ewing Ave
- 3072 Ewing Ave
- 3070 Highview Ave
- 3061 Highview Ave
- 112 E Las Flores Dr
- 116 E Las Flores Dr
- 3070 Ewing Ave
Your Personal Tour Guide
Ask me questions while you tour the home.